


1 / 2
0
Views
0
Plays


0.0
0
0 Likes
Explore Culture with this Quiz
0 Views
0 Plays
Paste this activity's link or code into your existing LMS (Google Classroom, Canvas, Teams, Schoology, Moodle, etc.).
Students can open and work on the activity right away, with no student login required.
You'll still be able to track student progress and results from your teacher account.
Information
Description
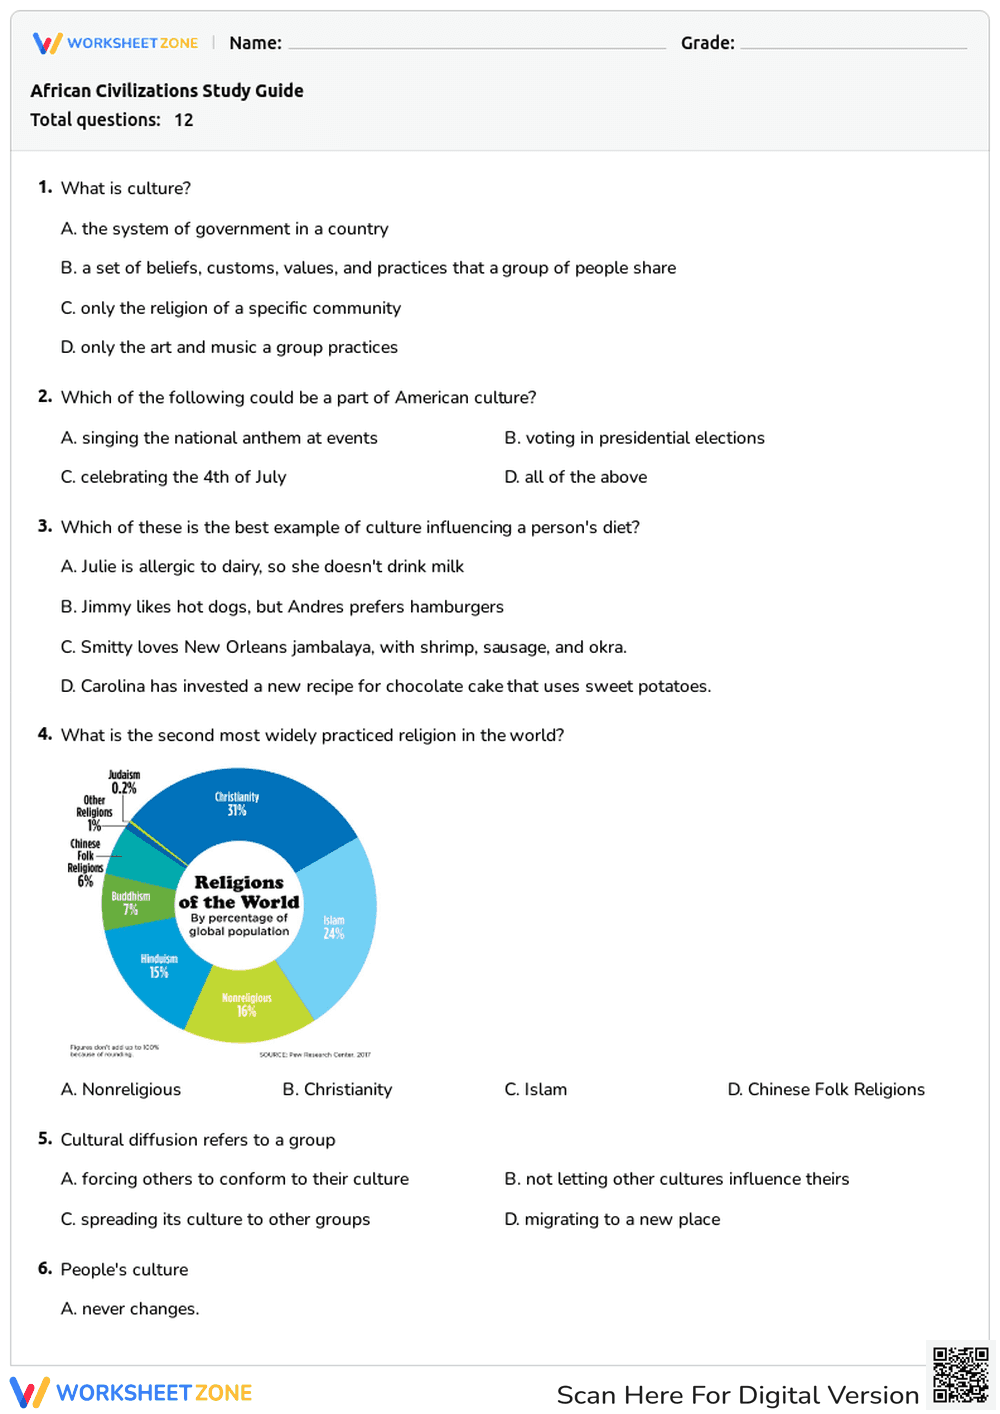
What It Is:
This is a pie chart illustrating the distribution of the world's religions by percentage of global population. It includes categories for Christianity (31%), Islam (24%), Hinduism (15%), Nonreligious (16%), Buddhism (7%), Chinese Folk Religions (6%), Other Religions (1%), and Judaism (0.2%). The chart is sourced from the Pew Research Center, 2017.
Grade Level Suitability:
Grades 6-12. This resource is suitable for middle and high school students studying social studies, geography, or world religions. The data is presented in a clear, visual format making it accessible for these age groups.
Why Use It:
This chart helps students visualize the relative sizes of different religious groups globally. It promotes understanding of cultural diversity and provides a basis for discussions about demographics and religious studies.
How to Use It:
Use this chart as a visual aid during lessons about world religions. Students can analyze the data, compare the sizes of different groups, and discuss the implications of the distribution. It can also be used as a starting point for research projects on specific religions.
Target Users:
Teachers and students studying social studies, world history, geography, or comparative religion. Anyone interested in learning about the global distribution of religions.