


0
Views
0
Downloads

0.0
0
0 Likes
Making Histograms: Independent Practice
0 Views
0 Downloads
Paste this activity's link or code into your existing LMS (Google Classroom, Canvas, Teams, Schoology, Moodle, etc.).
Students can open and work on the activity right away, with no student login required.
You'll still be able to track student progress and results from your teacher account.
Information
Description
What It Is:
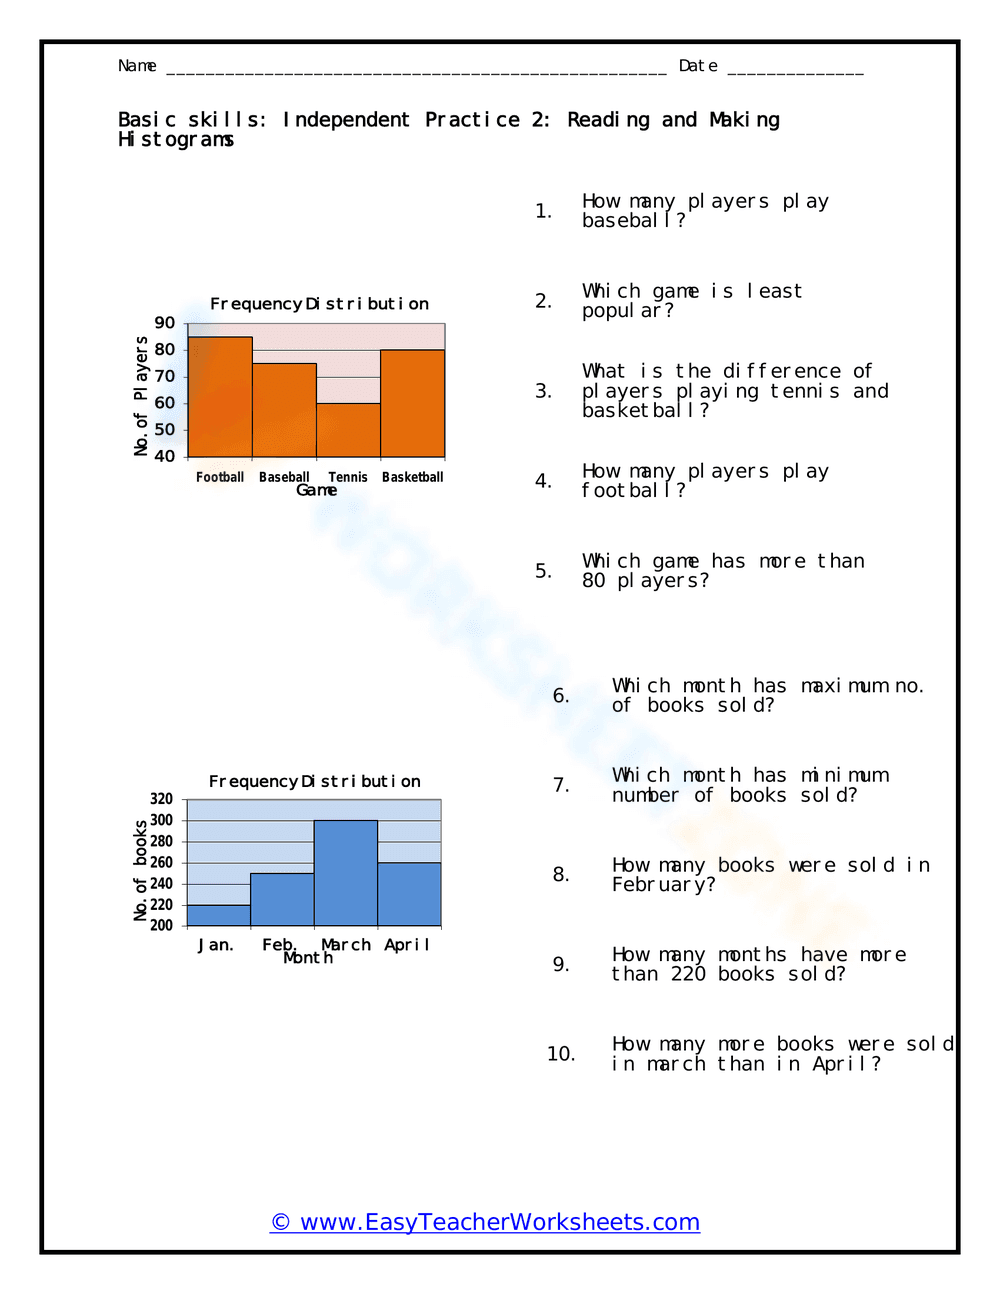
This is a worksheet designed for independent practice, focusing on reading and interpreting histograms. It presents two histograms: one showing the number of players in different sports (football, baseball, tennis, and basketball) and the other showing the number of books sold in different months (January, February, March, and April). The worksheet includes ten questions that require students to analyze the data presented in the histograms, such as determining the number of players for a specific sport, finding the least popular game, or calculating the difference in book sales between months.
Grade Level Suitability:
This worksheet is suitable for grades 3-5. The concepts of reading and interpreting histograms are typically introduced in these grades. The questions are straightforward and focus on basic data analysis skills, making it appropriate for students in this age range.
Why Use It:
This worksheet helps students develop essential skills in data interpretation and analysis. It reinforces the ability to read and understand histograms, extract information from visual representations, and answer questions based on the data. It promotes critical thinking and problem-solving skills in a mathematical context.
How to Use It:
Students should first carefully examine the histograms provided. Then, they should read each question and use the information from the histograms to determine the correct answer. The worksheet can be used for independent practice, homework, or as an assessment tool. Encourage students to show their work or explain their reasoning when answering the questions.
Target Users:
The target users are elementary school students in grades 3-5 who are learning about data representation and analysis, specifically histograms. It is also beneficial for students who need extra practice in reading and interpreting data presented in graphical form.