


1 / 21
0
Views
0
Downloads


0.0
0
0 Likes
Updated Best Fit Lines Worksheet for Data Analysis
0 Views
0 Downloads
Paste this activity's link or code into your existing LMS (Google Classroom, Canvas, Teams, Schoology, Moodle, etc.).
Students can open and work on the activity right away, with no student login required.
You'll still be able to track student progress and results from your teacher account.
Information
Description
What It Is:
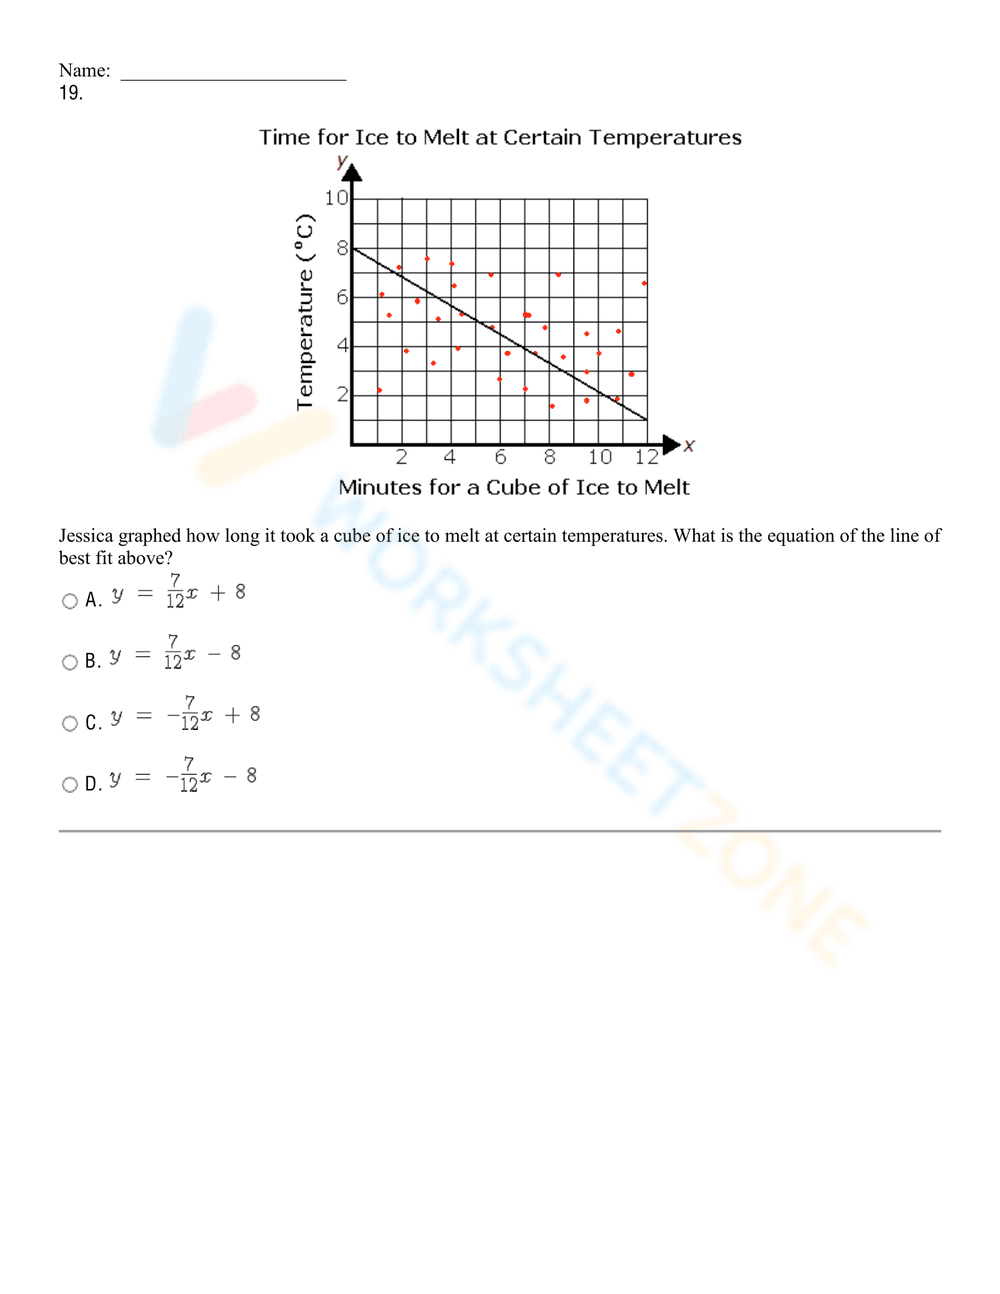
This is a worksheet with two math problems involving interpreting data from graphs. The first problem presents a scatter plot with a line of best fit showing the relationship between the number of pizzas sold and sales revenue. Students are asked to use the line of best fit to determine the number of pizzas sold for a given sales amount. The second problem presents a scatter plot showing the relationship between hours using a computer and pounds overweight. Students are asked to predict the pounds overweight for a given number of hours using a computer. Both questions are multiple choice.
Grade Level Suitability:
This worksheet is suitable for grades 7-9. It requires students to understand scatter plots, lines of best fit, and interpreting data from graphs, which are concepts typically introduced in middle school math.
Why Use It:
This worksheet reinforces skills in reading and interpreting scatter plots, making predictions based on data, and understanding the concept of line of best fit. It helps students develop critical thinking and data analysis skills.
How to Use It:
Students should read each problem carefully, examine the graph provided, and use the line of best fit to estimate the answer to the question. They should then select the best answer from the multiple-choice options.
Target Users:
This worksheet is designed for students in middle school (grades 7-9) who are learning about data analysis, scatter plots, and lines of best fit. It can be used for classroom practice, homework assignments, or test preparation.