


0
Views
0
Downloads

0.0
0
0 Likes
Census Data on Working for a Living
0 Views
0 Downloads
Paste this activity's link or code into your existing LMS (Google Classroom, Canvas, Teams, Schoology, Moodle, etc.).
Students can open and work on the activity right away, with no student login required.
You'll still be able to track student progress and results from your teacher account.
Information
Description
What It Is:
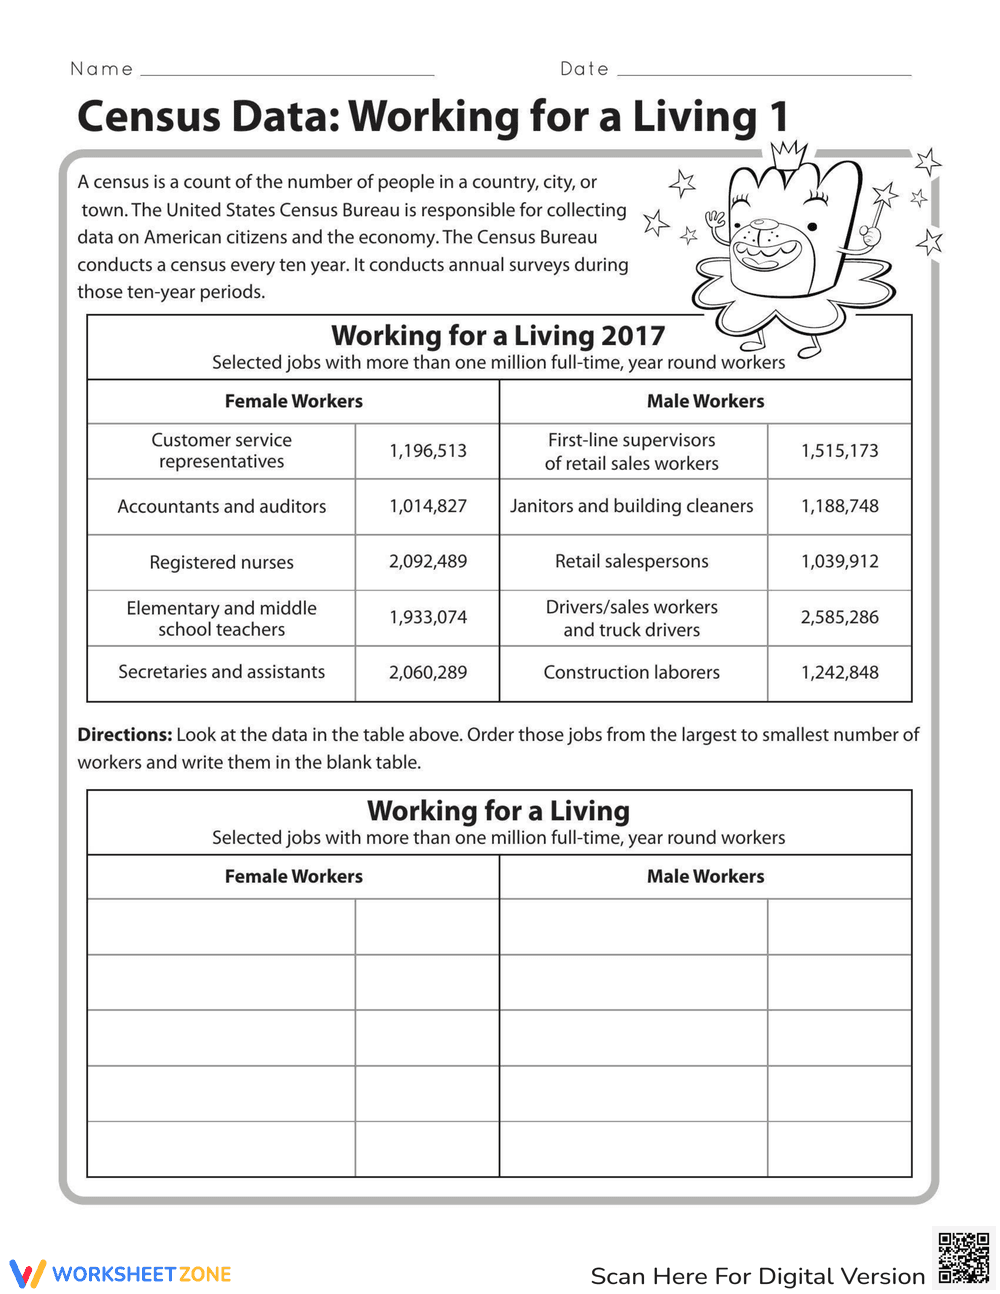
This is an educational worksheet titled 'Census Data: Working for a Living 1.' It presents census data from 2017 showing the number of female and male workers in selected jobs with more than one million full-time, year-round workers. The worksheet includes a table with job titles and corresponding worker numbers. The activity requires students to reorder the jobs from the largest to smallest number of workers in a blank table provided below.
Grade Level Suitability:
This worksheet is suitable for grades 4-6. It involves reading and interpreting data from a table, comparing numbers, and ordering them. The vocabulary and concepts are appropriate for this age range.
Why Use It:
This worksheet helps students develop data analysis skills, specifically reading and interpreting numerical data presented in a table. It also reinforces number comparison and ordering skills. Furthermore, it introduces the concept of census data and its relevance to understanding the workforce.
How to Use It:
Students should first read the introductory paragraph to understand the purpose of a census. Then, they should carefully examine the data table, noting the job titles and the number of workers for each. Next, they should compare the numbers and reorder the jobs from largest to smallest, writing them in the corresponding 'Female Workers' and 'Male Workers' columns in the blank table provided.
Target Users:
This worksheet is designed for elementary and middle school students who are learning about data analysis, number comparison, and basic economic concepts. It can be used in math, social studies, or economics lessons.