


1 / 2
0
Views
0
Downloads


0.0
0
0 Likes
Understanding Constant of Proportionality
0 Views
0 Downloads
Paste this activity's link or code into your existing LMS (Google Classroom, Canvas, Teams, Schoology, Moodle, etc.).
Students can open and work on the activity right away, with no student login required.
You'll still be able to track student progress and results from your teacher account.
Information
Description
What It Is:
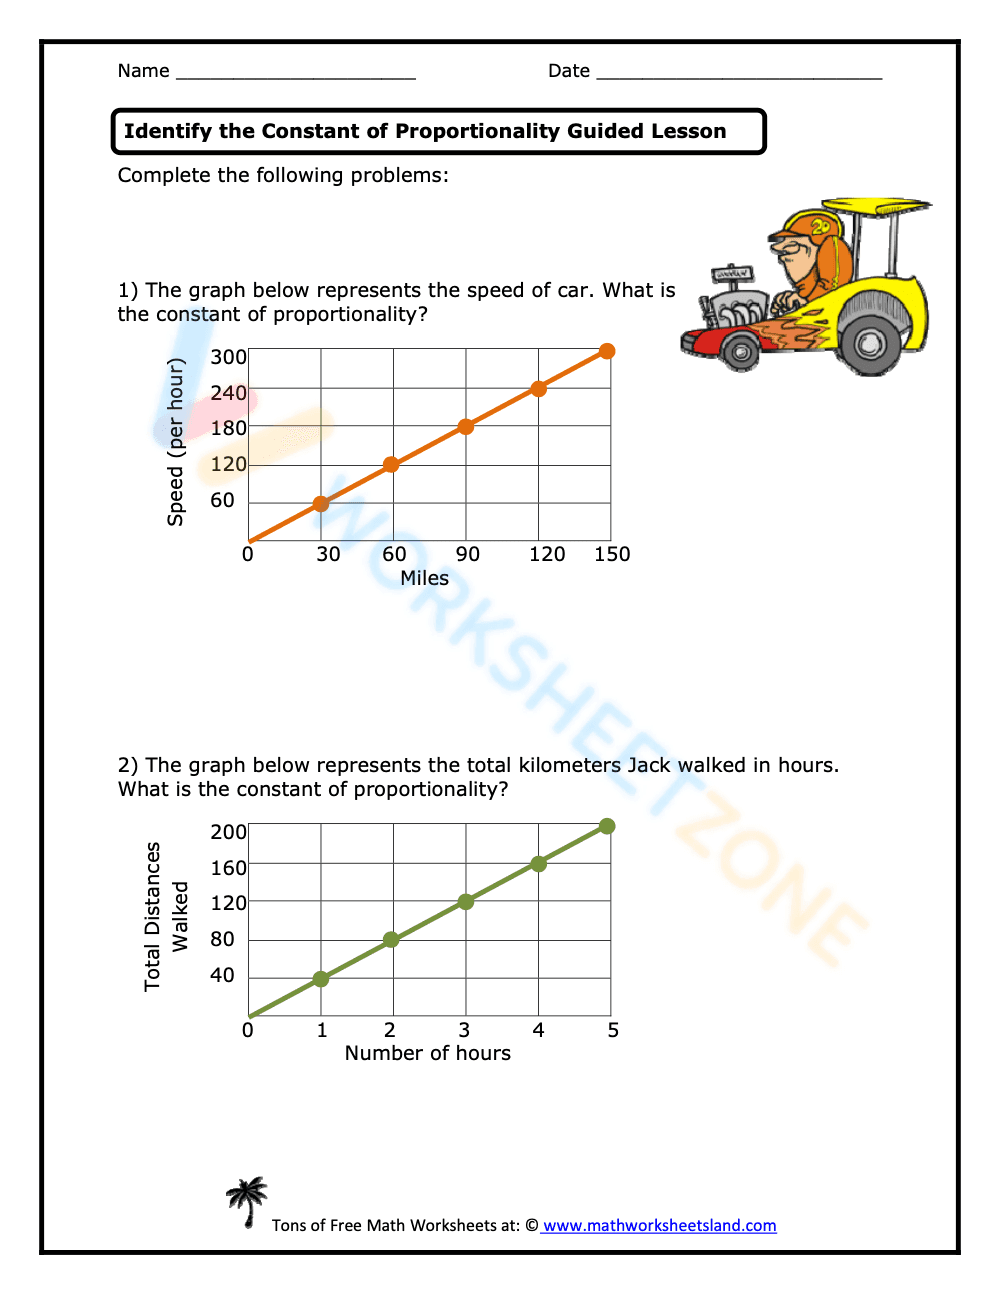
This is a math worksheet focusing on identifying the constant of proportionality. It presents two problems, each featuring a graph. The first graph depicts the speed of a car (speed per hour vs. miles), and the second graph shows the total kilometers Jack walked in hours (total distance walked vs. number of hours). Students are asked to determine the constant of proportionality from each graph.
Grade Level Suitability:
This worksheet is suitable for grades 6-8. It requires understanding of linear relationships, graphs, and the concept of proportionality, which are typically introduced in these grade levels.
Why Use It:
This worksheet reinforces the concept of constant of proportionality and its graphical representation. It helps students develop skills in interpreting graphs and applying the concept of proportionality to real-world scenarios, such as speed and distance.
How to Use It:
Students should first examine each graph to identify the relationship between the x and y axes. They need to calculate the ratio between the dependent variable (speed or distance) and the independent variable (miles or hours) at different points on the graph. The constant of proportionality is this ratio.
Target Users:
This worksheet is designed for middle school students learning about proportionality and linear relationships. It is also useful for students who need additional practice in interpreting graphs and applying mathematical concepts to real-world problems.