


1 / 2
0
Views
0
Downloads

0.0
0
0 Likes
Master Constant of Proportionality
0 Views
0 Downloads
Paste this activity's link or code into your existing LMS (Google Classroom, Canvas, Teams, Schoology, Moodle, etc.).
Students can open and work on the activity right away, with no student login required.
You'll still be able to track student progress and results from your teacher account.
Information
Description
What It Is:
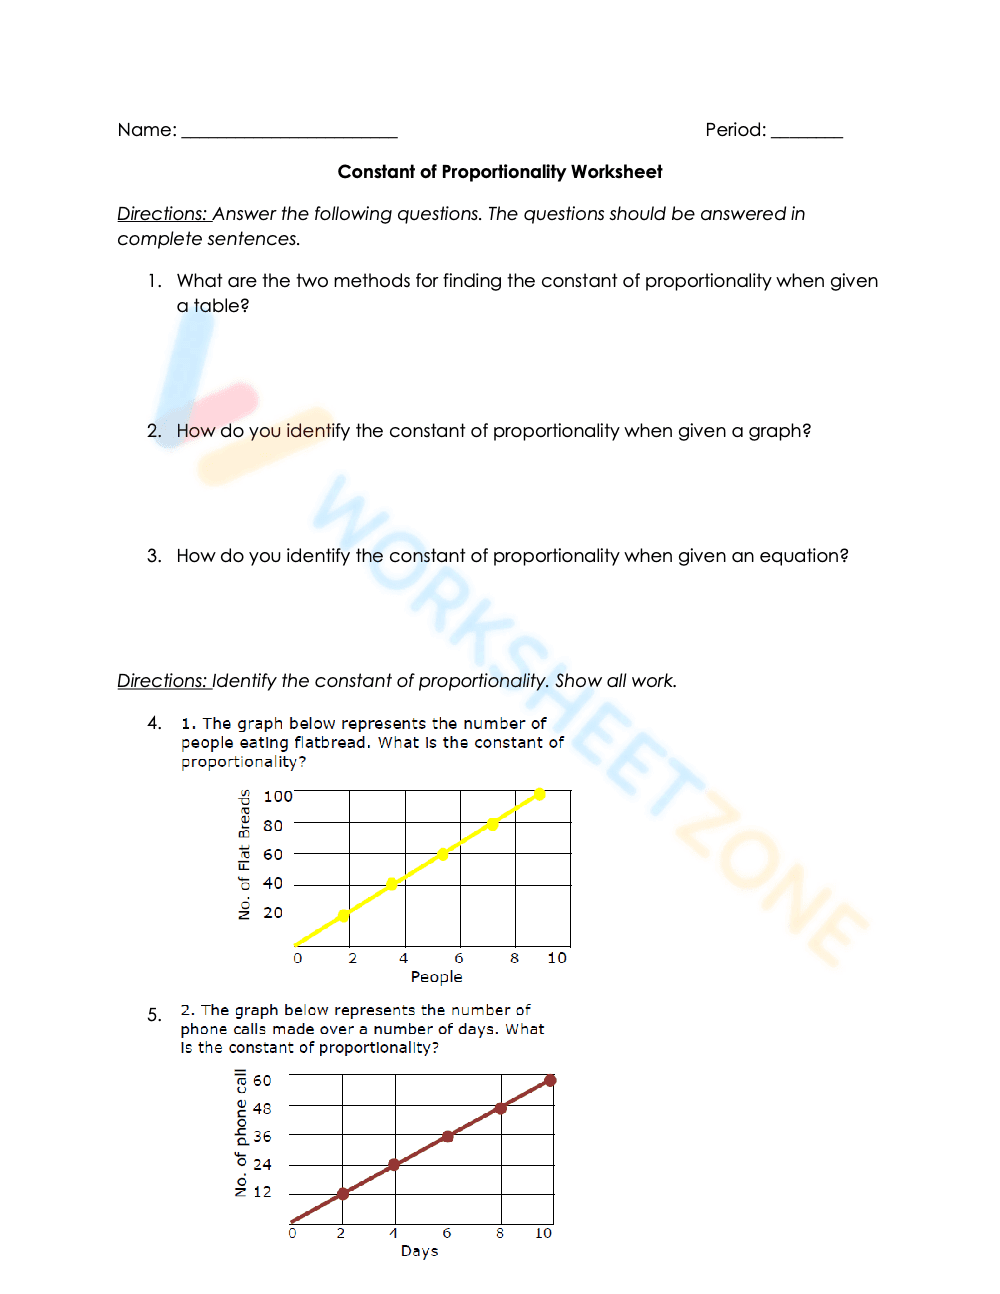
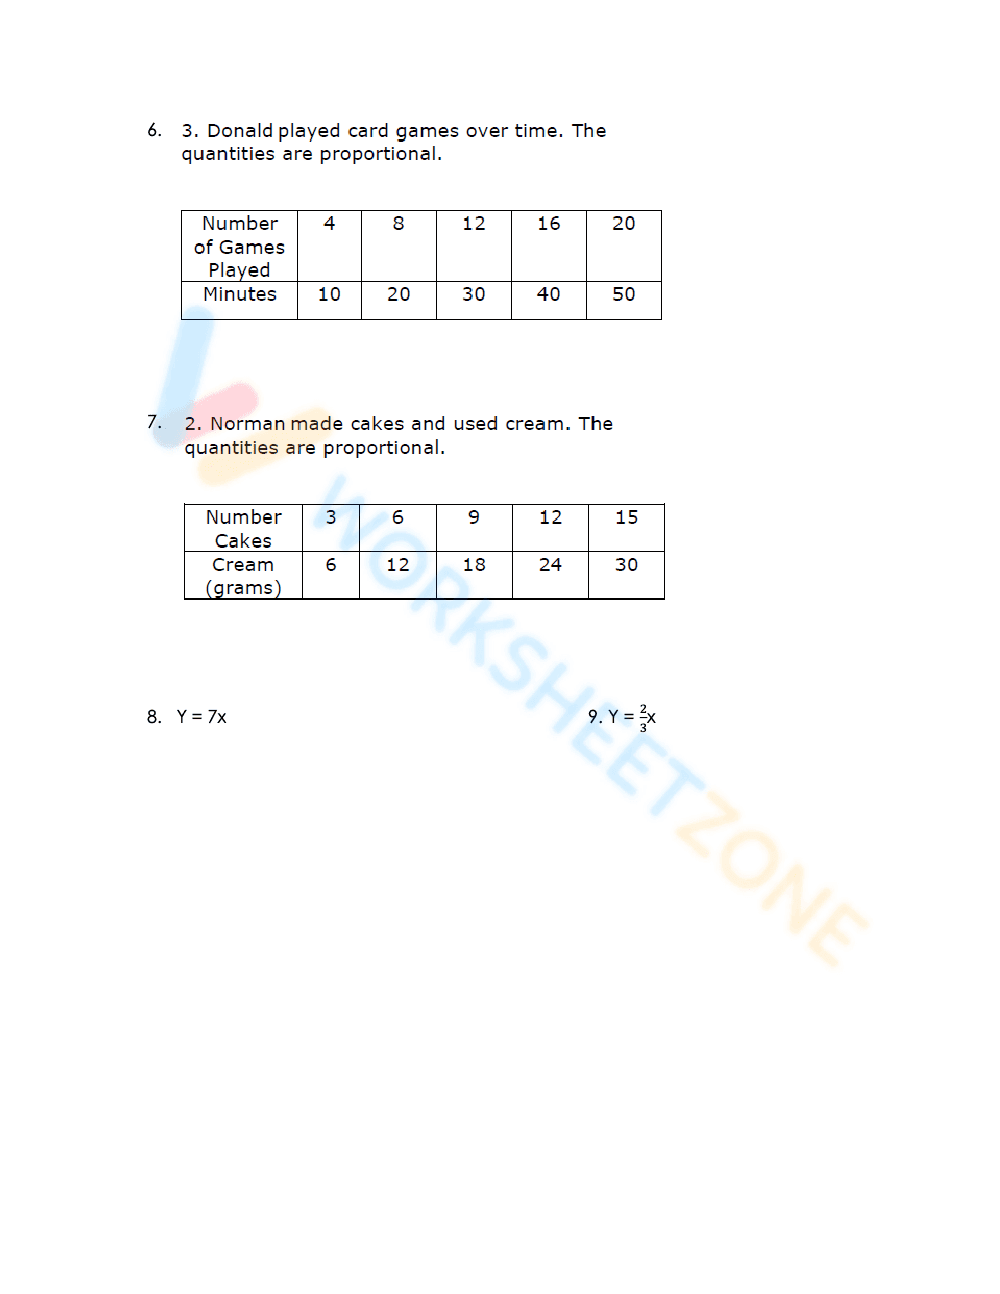
This is a 'Constant of Proportionality Worksheet'. It includes questions requiring complete sentence answers about finding the constant of proportionality from tables, graphs, and equations. It also includes questions where students must identify the constant of proportionality from two provided graphs, one showing the number of flatbreads eaten by people and the other showing the number of phone calls made over a number of days.
Grade Level Suitability:
This worksheet is suitable for grades 6-8. It covers the concept of constant of proportionality, which is typically introduced in middle school math curricula. The questions require understanding of tables, graphs, and linear equations, which are skills developed in these grades.
Why Use It:
This worksheet helps students practice and reinforce their understanding of constant of proportionality. It provides a variety of question types, including conceptual questions and problems involving graphs. It helps students develop critical thinking and problem-solving skills related to proportional relationships.
How to Use It:
Students should read the directions carefully and answer all questions. For the first three questions, they should write complete sentences explaining the concepts. For the graph questions, they need to show their work to identify the constant of proportionality from the provided graphs. The worksheet can be used for in-class practice, homework, or assessment.
Target Users:
This worksheet is ideal for middle school math students learning about constant of proportionality. It can be used by teachers as a supplementary resource or by parents to support their children's learning at home. It is also helpful for students who need extra practice with proportional relationships and graphing.