


0
Views
0
Downloads

0 Likes
Proportionality: Tables, Graphs, and Equations Worksheet
0 Views
0 Downloads
Paste this activity's link or code into your existing LMS (Google Classroom, Canvas, Teams, Schoology, Moodle, etc.).
Students can open and work on the activity right away, with no student login required.
You'll still be able to track student progress and results from your teacher account.
Information
Description
What It Is:
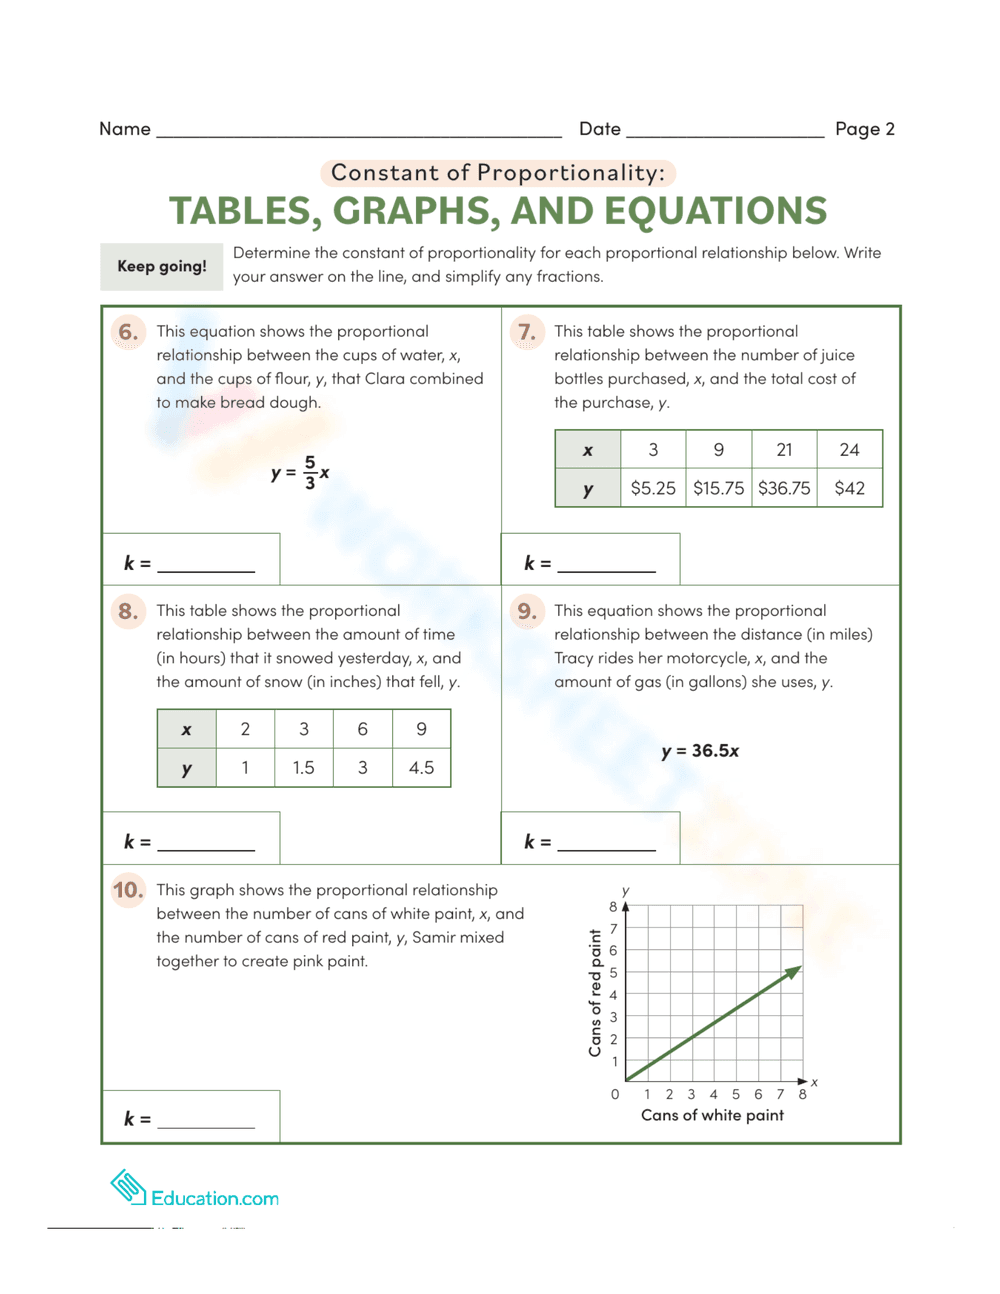
This is an educational worksheet focused on constant of proportionality, using tables, graphs, and equations. It presents problems where students need to determine the constant of proportionality (k) from various representations: equations (e.g., y = 5/3x), tables of values (showing proportional relationships between x and y), and a graph. One problem involves a graph showing the relationship between cans of white paint and cans of red paint.
Grade Level Suitability:
This worksheet is suitable for 6th to 8th grade. It requires understanding of proportional relationships, identifying constants of proportionality, and interpreting data from tables and graphs, which are typically covered in middle school math.
Why Use It:
It reinforces the concept of constant of proportionality and helps students connect different representations of proportional relationships: equations, tables, and graphs. It also provides practice in calculating and interpreting the constant of proportionality in real-world contexts, such as mixing paint or calculating costs.
How to Use It:
Students should analyze each problem, identify the proportional relationship, and calculate the constant of proportionality (k). For equations, they need to identify the coefficient of x. For tables, they can divide y by x for any pair of corresponding values. For the graph, they can find a point on the line and divide the y-coordinate by the x-coordinate. The answer should be written in the provided 'k=' space.
Target Users:
The target users are middle school students (grades 6-8) who are learning about proportional relationships and constant of proportionality. It is also suitable for students who need extra practice in interpreting tables, graphs, and equations related to proportional relationships.