


0
Views
0
Downloads

0.0
0
0 Likes
Cut Out Graph Sweets: Graphing Practice
0 Views
0 Downloads
Paste this activity's link or code into your existing LMS (Google Classroom, Canvas, Teams, Schoology, Moodle, etc.).
Students can open and work on the activity right away, with no student login required.
You'll still be able to track student progress and results from your teacher account.
Information
Description
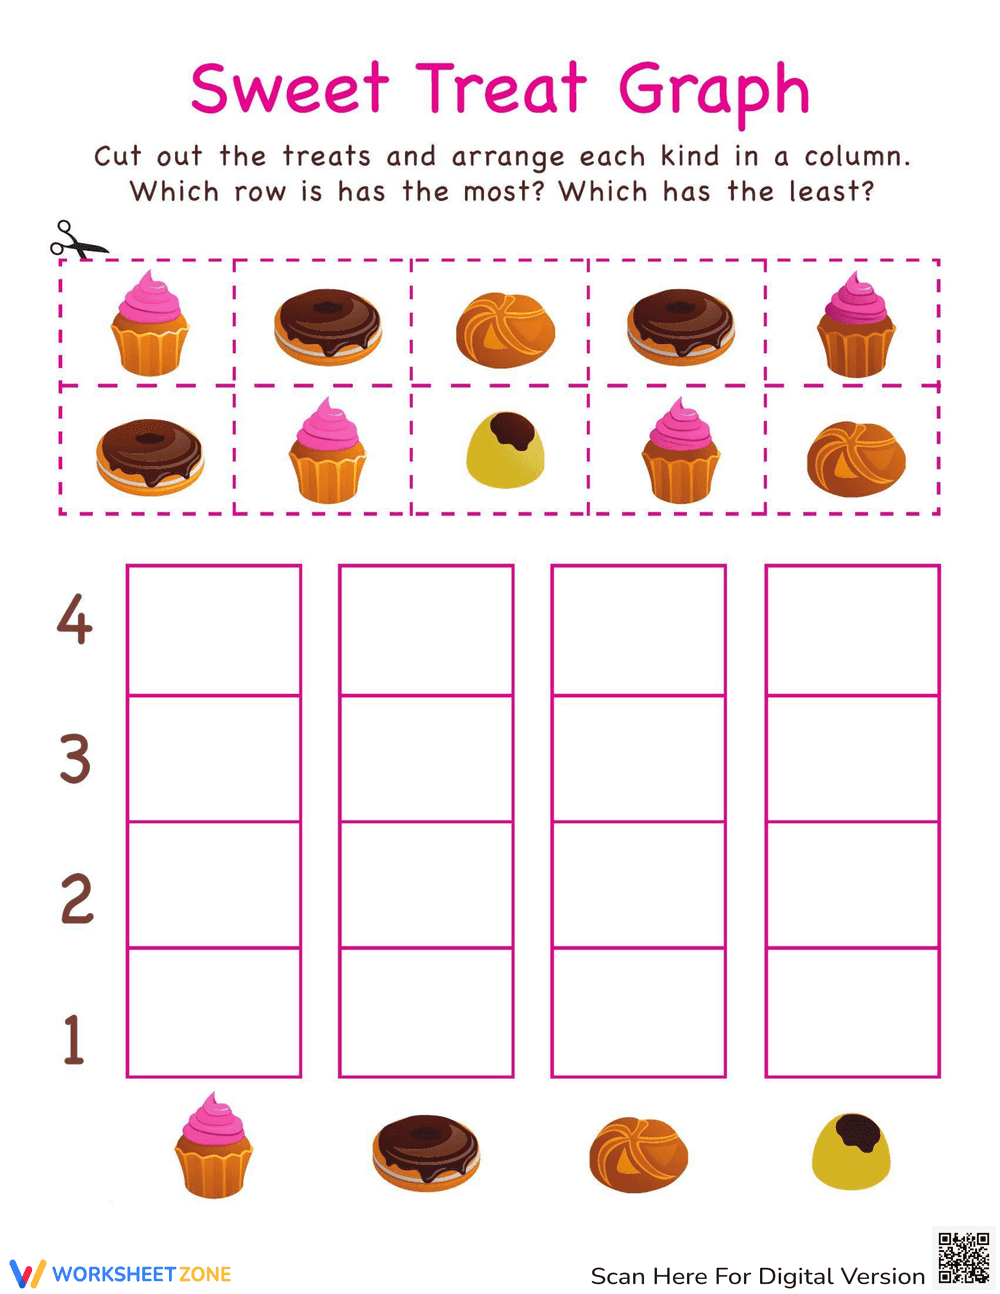
What It Is:
This is a cut-and-paste worksheet designed to introduce graphing concepts. It features a section of sweet treat images (cupcakes, donuts, buns, and yellow candies) to be cut out and then arranged into a bar graph below. The graph has four columns, one for each treat type, and rows numbered 1 to 4 to indicate quantity. The worksheet also includes questions about which row has the most and least items.
Grade Level Suitability:
Suitable for Kindergarten and 1st Grade. It uses simple counting and visual representation, making it appropriate for early learners who are beginning to understand basic graphing and data representation.
Why Use It:
This worksheet helps children develop early graphing skills, practice counting, and improve fine motor skills through cutting and pasting. It introduces the concept of data representation in a fun and engaging way, using familiar sweet treat images. It also helps with comparing quantities (most vs. least).
How to Use It:
First, cut out the individual sweet treat images. Then, count how many of each type of treat there are. Finally, paste the treats into the corresponding column of the bar graph, stacking them to represent the quantity of each type. After completing the graph, answer the questions about which row has the most and least.
Target Users:
This worksheet is designed for kindergarten and first-grade students who are learning about graphing, counting, and data representation. It is also useful for students who need to improve their fine motor skills through cutting and pasting activities.