


0
Views
0
Downloads

0.0
0
0 Likes
Cut Out Graph: Vegetables Worksheet
0 Views
0 Downloads
Paste this activity's link or code into your existing LMS (Google Classroom, Canvas, Teams, Schoology, Moodle, etc.).
Students can open and work on the activity right away, with no student login required.
You'll still be able to track student progress and results from your teacher account.
Information
Description
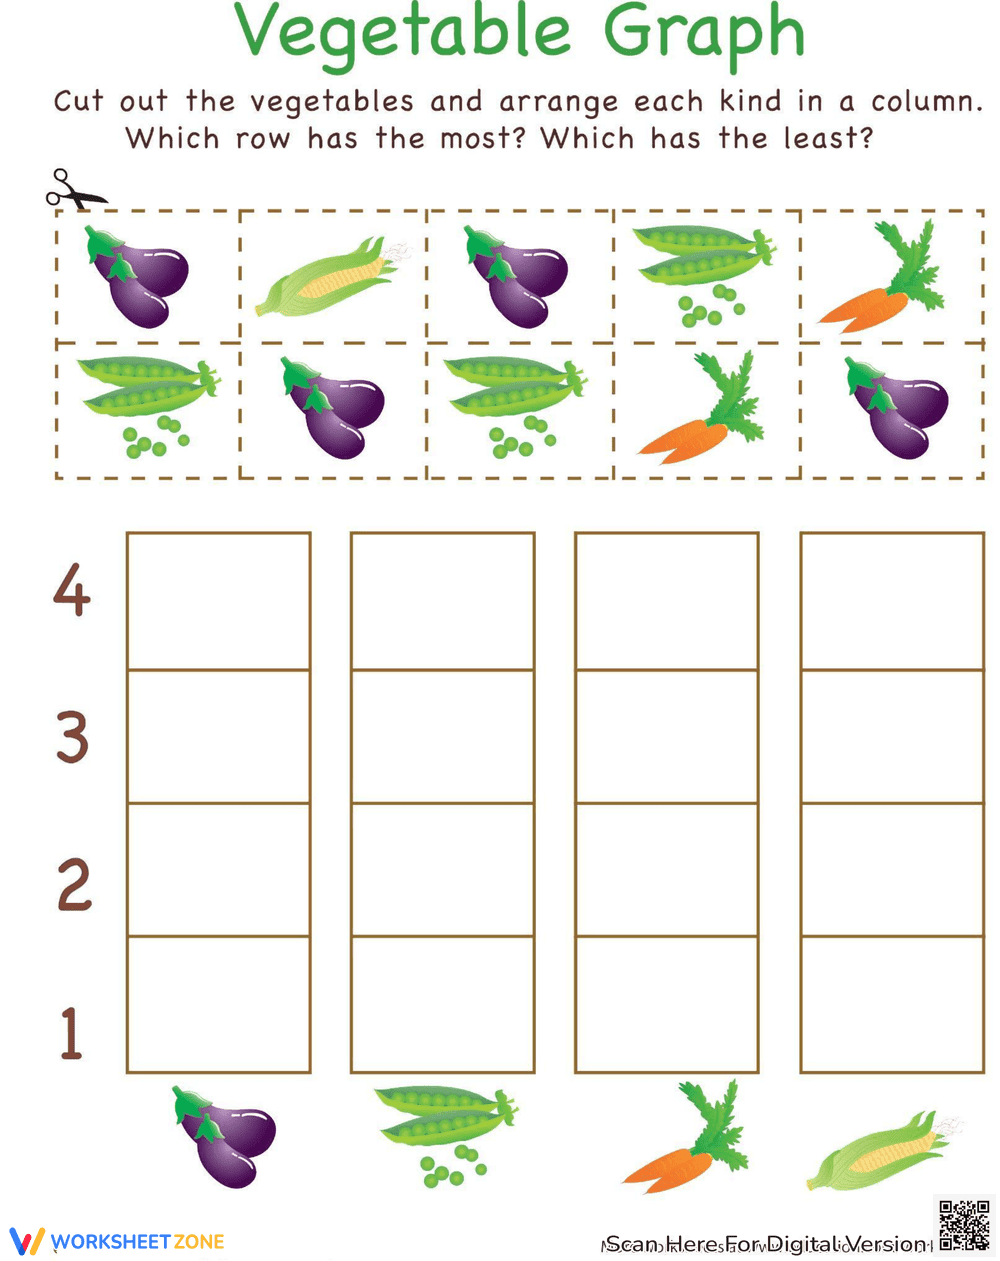
What It Is:
This is a printable worksheet titled 'Vegetable Graph.' It features images of different vegetables (eggplant, corn, peas, carrots) to be cut out. Students are instructed to arrange each kind of vegetable in a column and then determine which row has the most and which has the least. A blank bar graph is provided for organizing the vegetables, with numbers 1 through 4 labeled on the y-axis.
Grade Level Suitability:
This worksheet is suitable for Kindergarten and 1st grade. The activity involves cutting, sorting, and simple counting to create a visual graph, which aligns with early math and fine motor skill development for these grade levels.
Why Use It:
This worksheet helps develop graphing skills, counting skills, and fine motor skills through cutting and pasting. It introduces the concept of data representation in a fun, visually appealing way. It also reinforces vocabulary related to different types of vegetables.
How to Use It:
First, have the student cut out the vegetable images. Next, instruct them to sort the vegetables by type and paste each type into its own column on the graph. Finally, guide the student to count the number of each vegetable and determine which column has the most and the least.
Target Users:
This worksheet is designed for preschool, kindergarten, and first-grade students learning about graphing, data representation, and basic counting skills. It is also useful for teachers and parents looking for engaging math activities related to vegetables.