


1 / 8
0
Views
0
Downloads


0.0
0
0 Likes
Ecological Relationships: Updated Worksheet
0 Views
0 Downloads
Paste this activity's link or code into your existing LMS (Google Classroom, Canvas, Teams, Schoology, Moodle, etc.).
Students can open and work on the activity right away, with no student login required.
You'll still be able to track student progress and results from your teacher account.
Information
Description
What It Is:
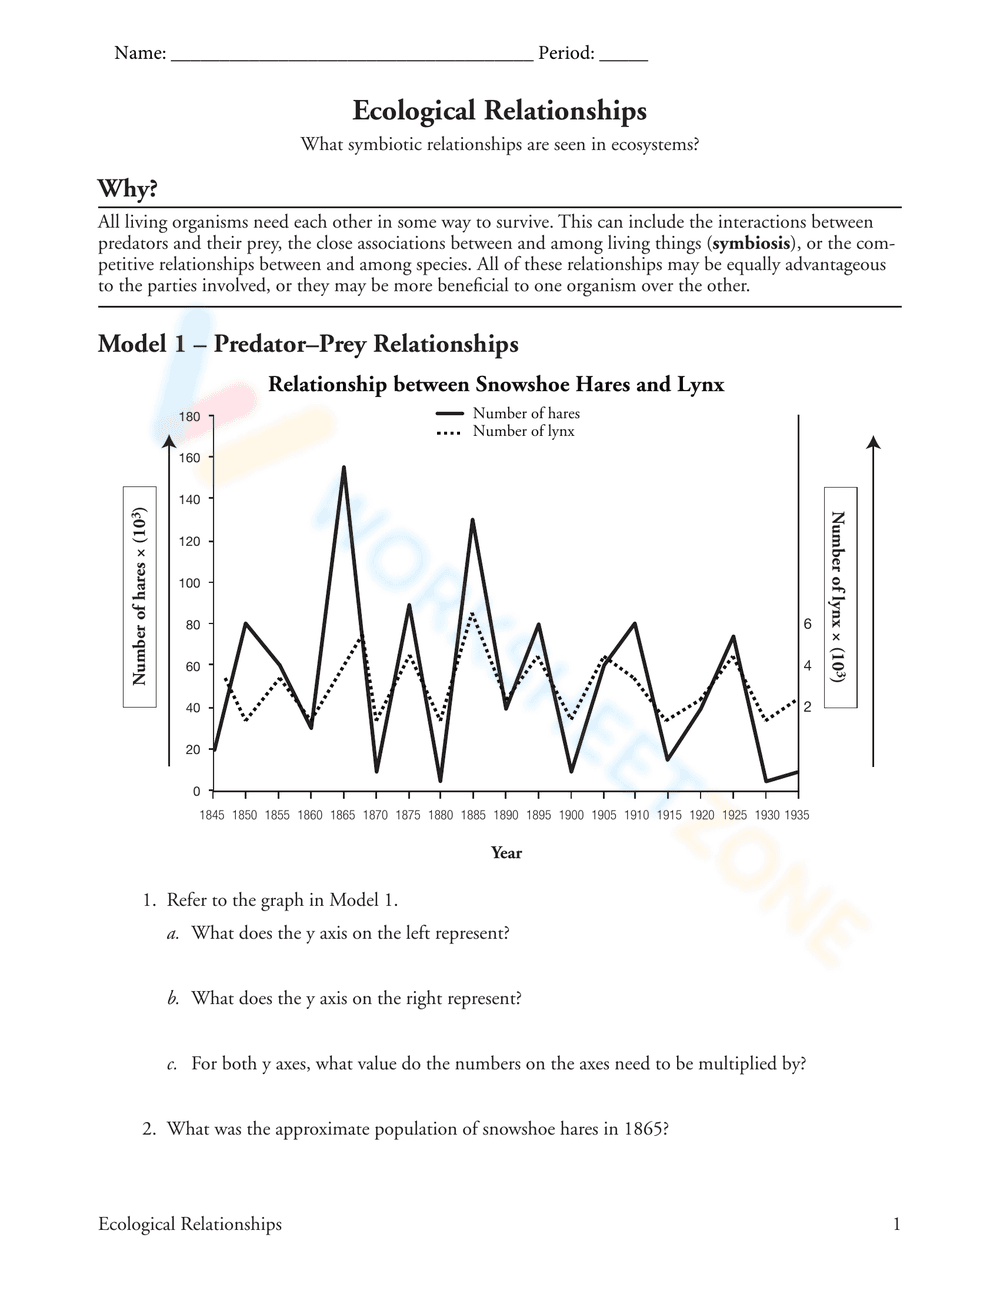
This is an educational worksheet focusing on ecological relationships, specifically predator-prey dynamics. It includes a graph illustrating the relationship between snowshoe hares and lynx populations over time (from 1845 to 1930). The worksheet includes questions prompting students to analyze the graph, identify what the y-axes represent (hares and lynx populations), determine the multiplication factor for the y-axis values, and estimate the hare population in a specific year (1865). The worksheet begins with an introductory paragraph explaining symbiotic relationships and the interdependence of organisms.
Grade Level Suitability:
This worksheet is suitable for grades 7-10, particularly in middle school or early high school biology or environmental science classes. The complexity of graph interpretation and the understanding of ecological concepts like predator-prey relationships align with these grade levels.
Why Use It:
This worksheet helps students develop skills in data analysis, graph interpretation, and understanding ecological concepts. It reinforces the understanding of predator-prey relationships and how populations fluctuate in response to each other. It also encourages critical thinking by asking students to analyze and draw conclusions from the provided data.
How to Use It:
Students should first read the introductory paragraph to understand the context of ecological relationships. Then, they should carefully examine the graph, paying attention to the axes and the different lines representing hare and lynx populations. They should then answer the questions, using the graph to find the necessary information. Encourage students to show their work or explain their reasoning.
Target Users:
This worksheet is ideal for students learning about ecology, population dynamics, and predator-prey relationships in science classes. It's also useful for students who need practice interpreting graphs and analyzing data. Teachers can use it as a classroom activity, homework assignment, or assessment tool.