


1 / 6
0
Views
0
Downloads

0.0
0
0 Likes
Graph Linear Functions with this Practice Worksheet
0 Views
0 Downloads
Paste this activity's link or code into your existing LMS (Google Classroom, Canvas, Teams, Schoology, Moodle, etc.).
Students can open and work on the activity right away, with no student login required.
You'll still be able to track student progress and results from your teacher account.
Information
Description
What It Is:
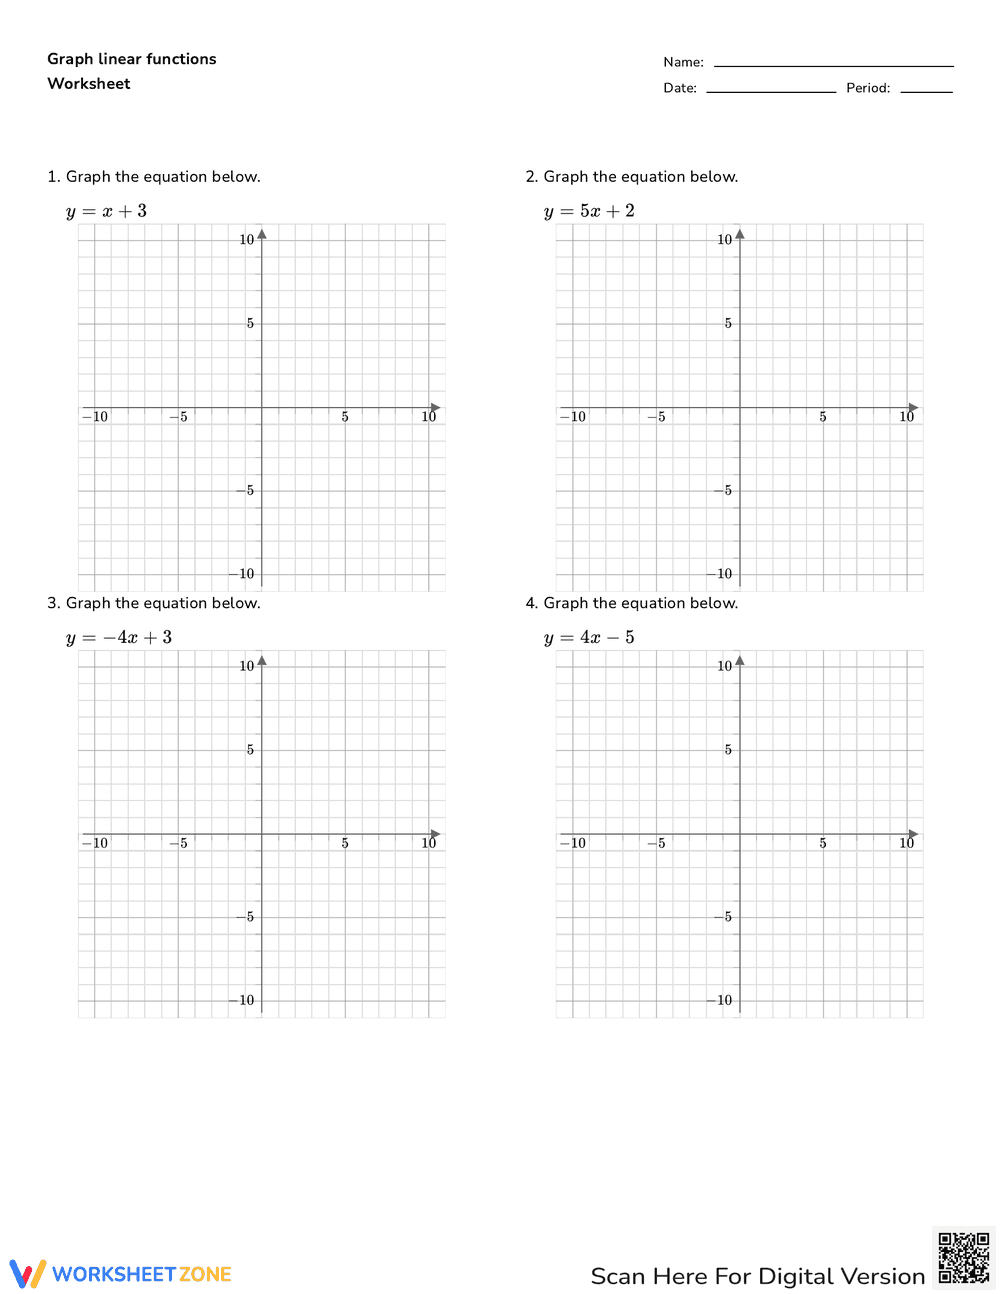
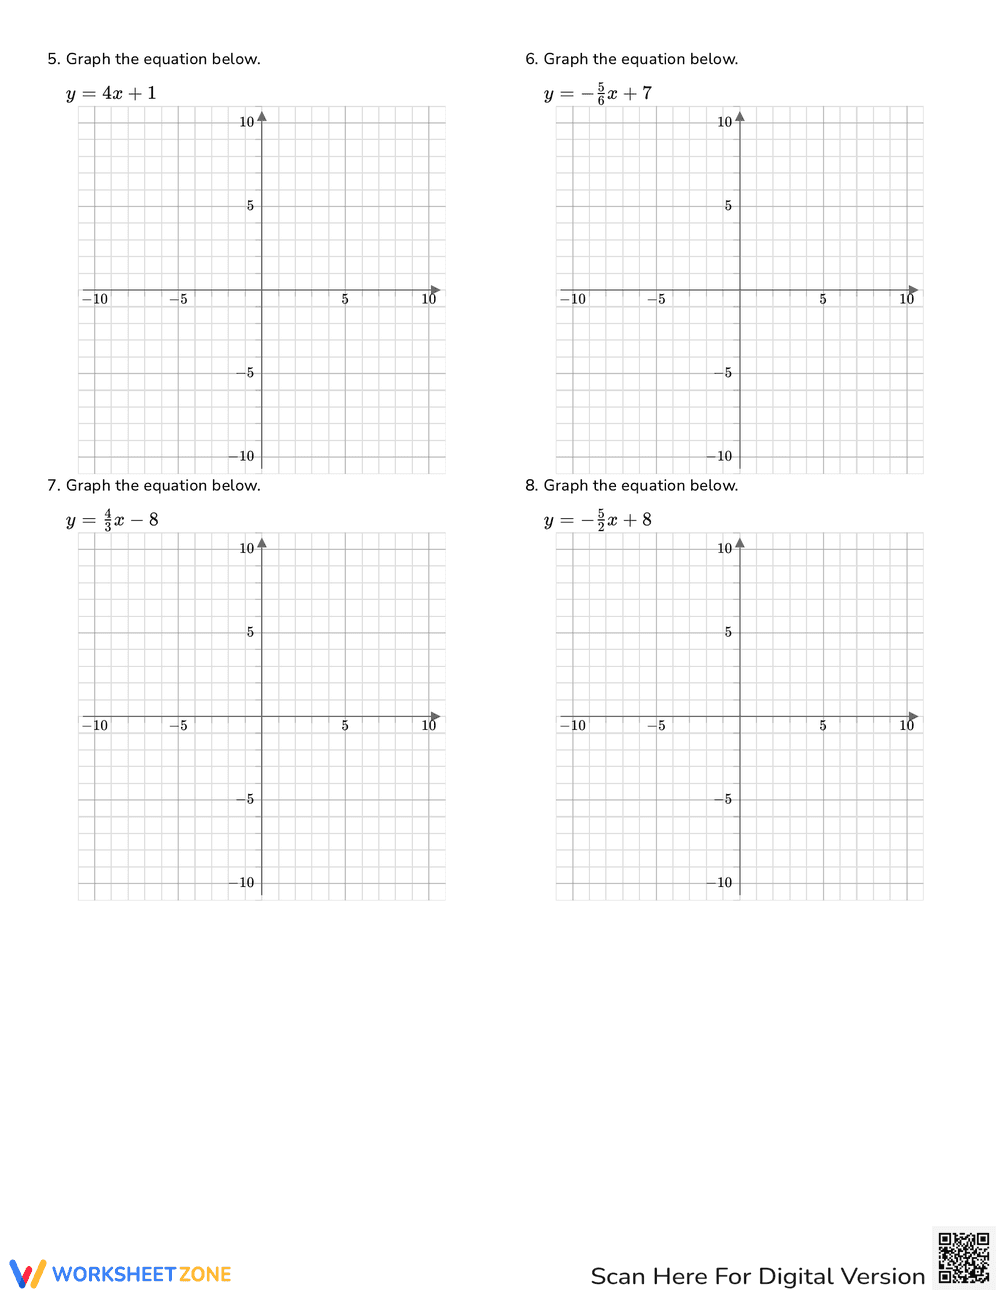
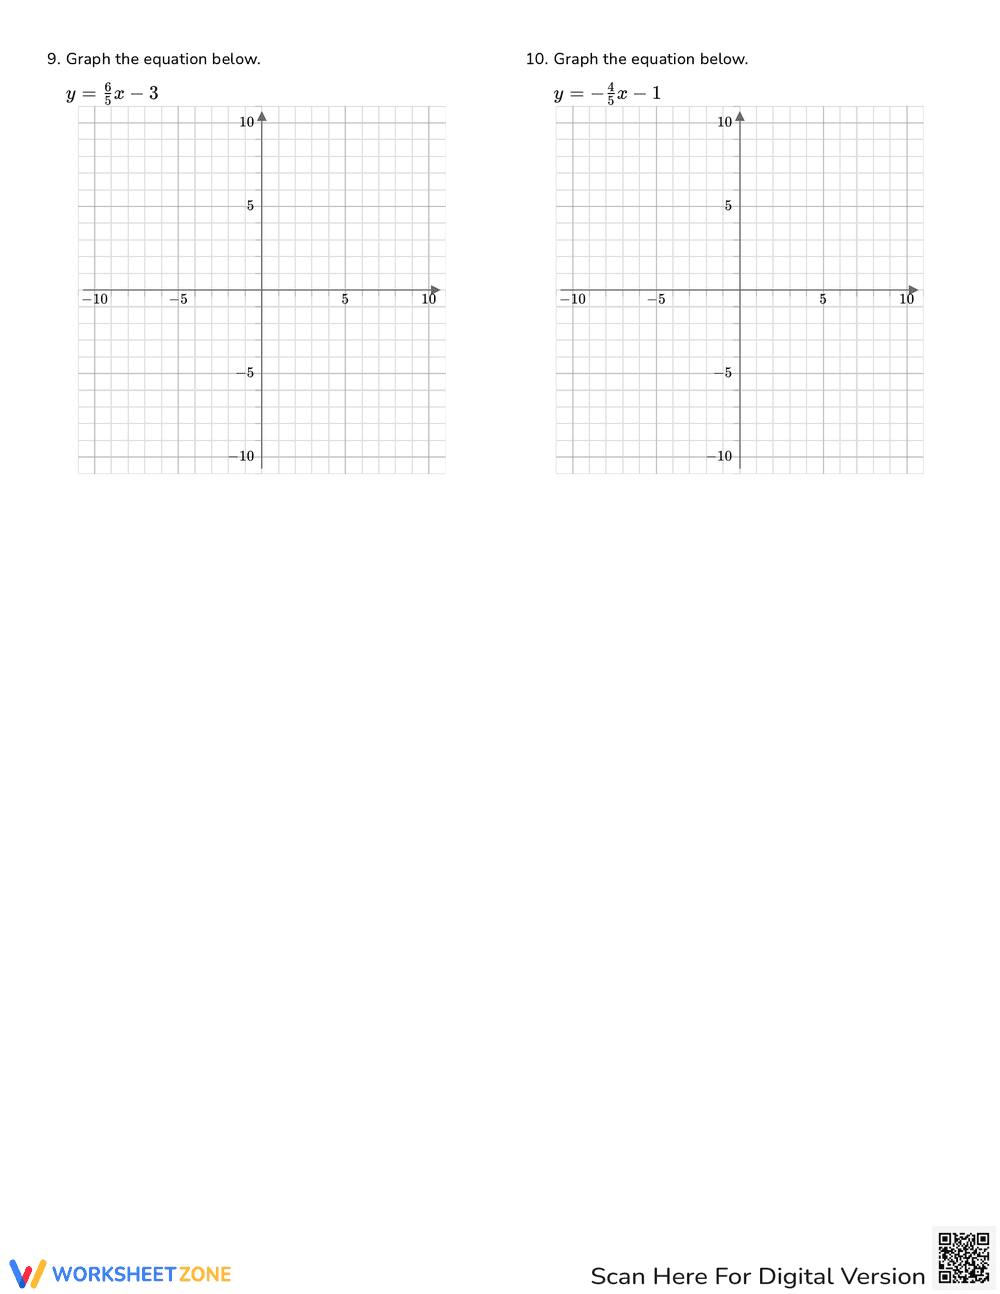
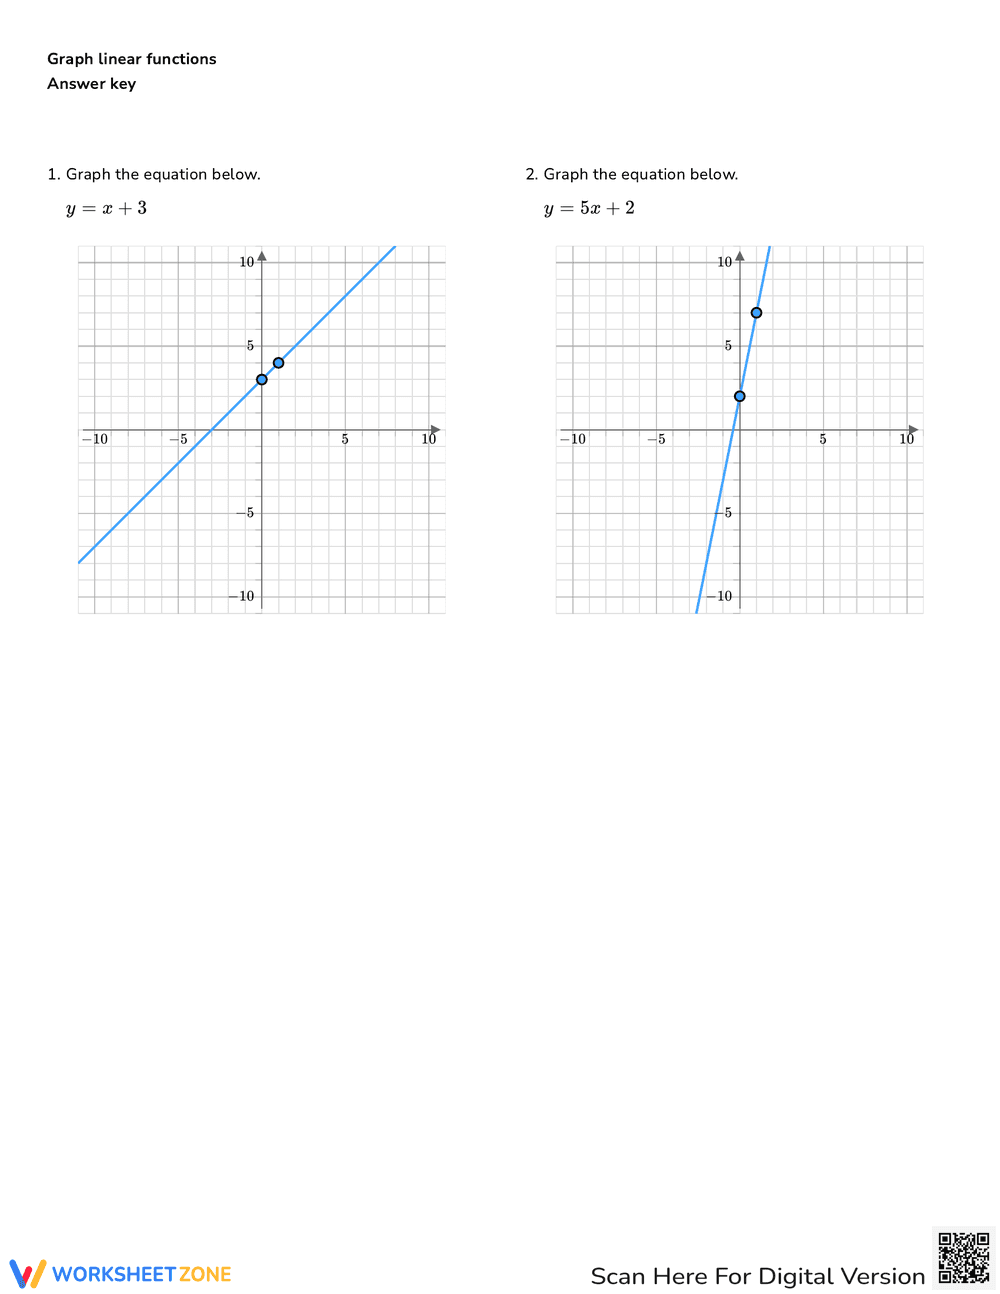
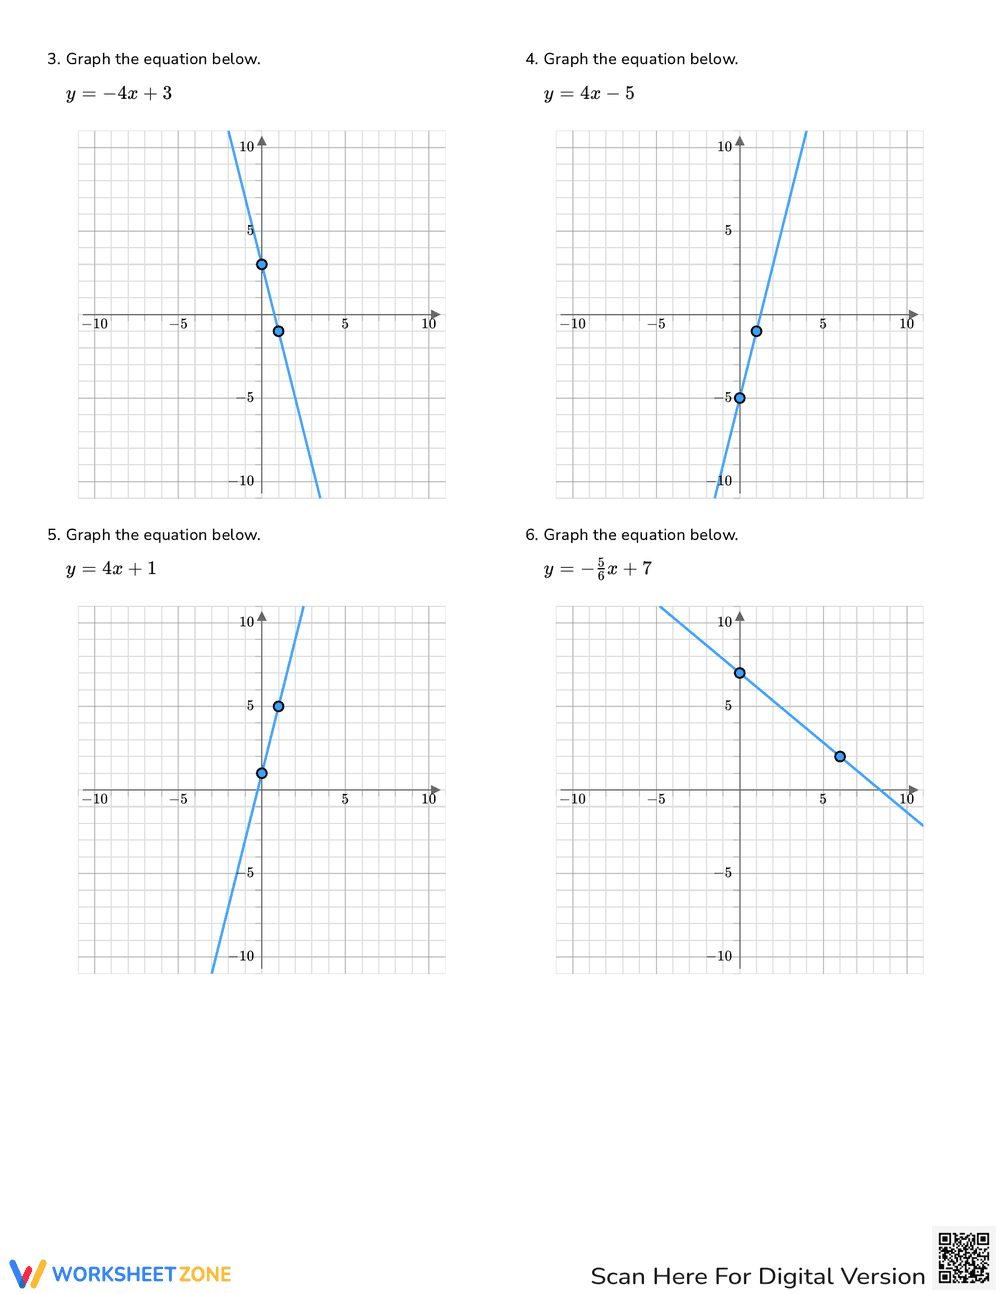
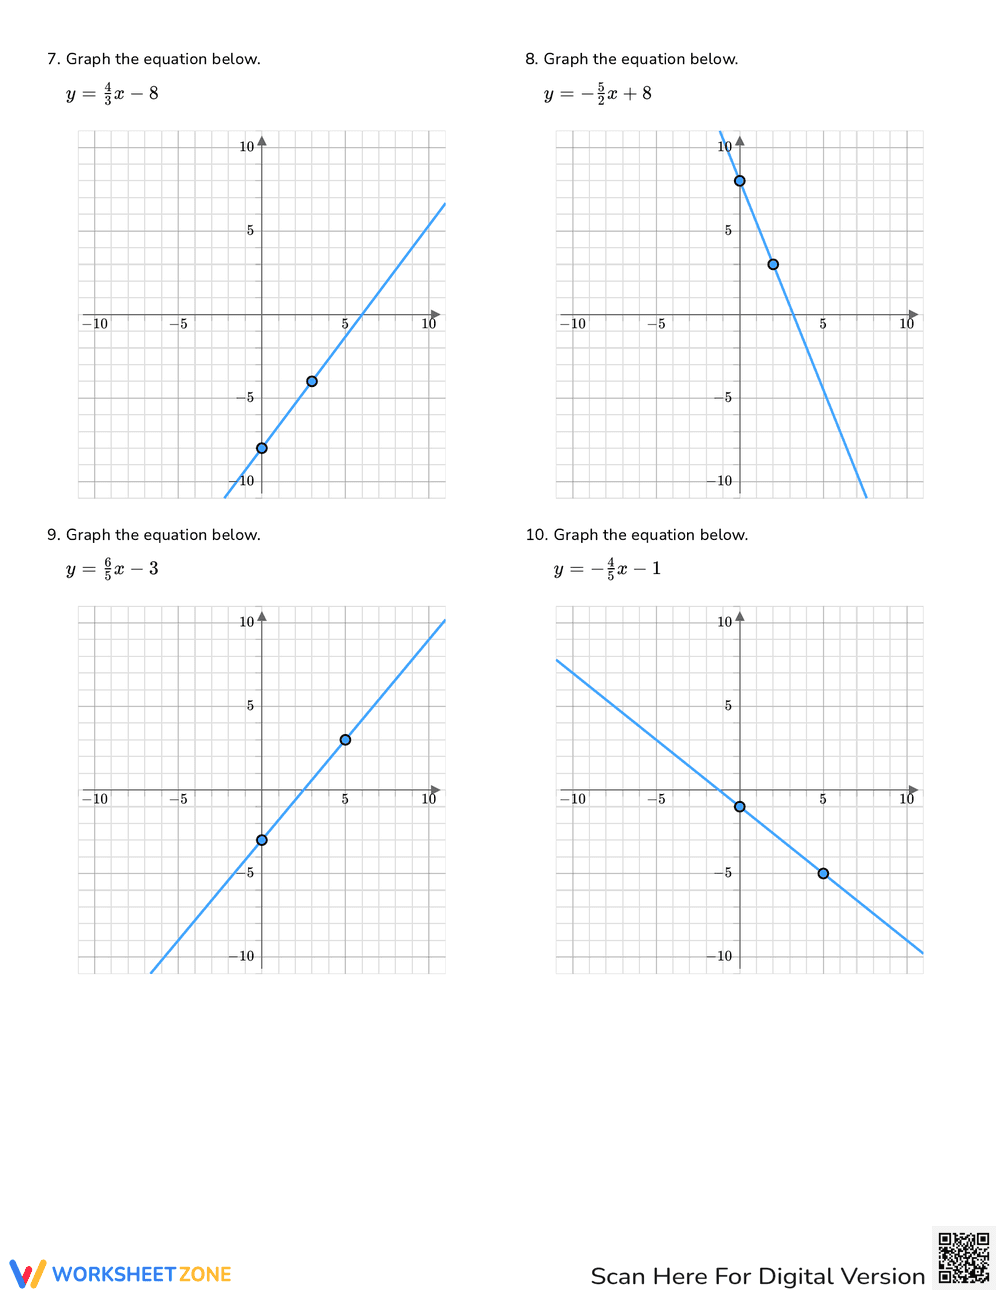
This is a math worksheet focused on graphing linear functions. The worksheet presents four separate problems where students are given a linear equation (e.g., y = x + 3, y = 5x + 2, y = -4x + 3, y = 4x - 5) and asked to graph the equation on a provided coordinate plane. There are spaces for Name, Date and Period at the top.
Grade Level Suitability:
This worksheet is suitable for grades 8-10, particularly Algebra 1. It assumes students have a basic understanding of linear equations and how to plot points on a coordinate plane. The equations provided are relatively simple, making it suitable for introducing or reinforcing the concept of graphing linear functions.
Why Use It:
This worksheet provides practice in visualizing and representing linear equations graphically. It helps students connect the algebraic representation of a line with its visual representation on a graph. By graphing the equations, students reinforce their understanding of slope, y-intercept, and how these parameters affect the line's position and direction.
How to Use It:
Students should first analyze each equation to determine the slope and y-intercept. Then, they can plot the y-intercept on the coordinate plane and use the slope to find additional points on the line. Finally, they should draw a straight line through the points to represent the graph of the equation.
Target Users:
The target users are students learning about linear equations and graphing in middle school or high school math classes, particularly Algebra 1. It can also be used as a review for students in higher-level math courses.