


1 / 4
0
Views
0
Downloads

0.0
0
0 Likes
Graphing Absolute Value Equations
0 Views
0 Downloads
Paste this activity's link or code into your existing LMS (Google Classroom, Canvas, Teams, Schoology, Moodle, etc.).
Students can open and work on the activity right away, with no student login required.
You'll still be able to track student progress and results from your teacher account.
Information
Description
What It Is:
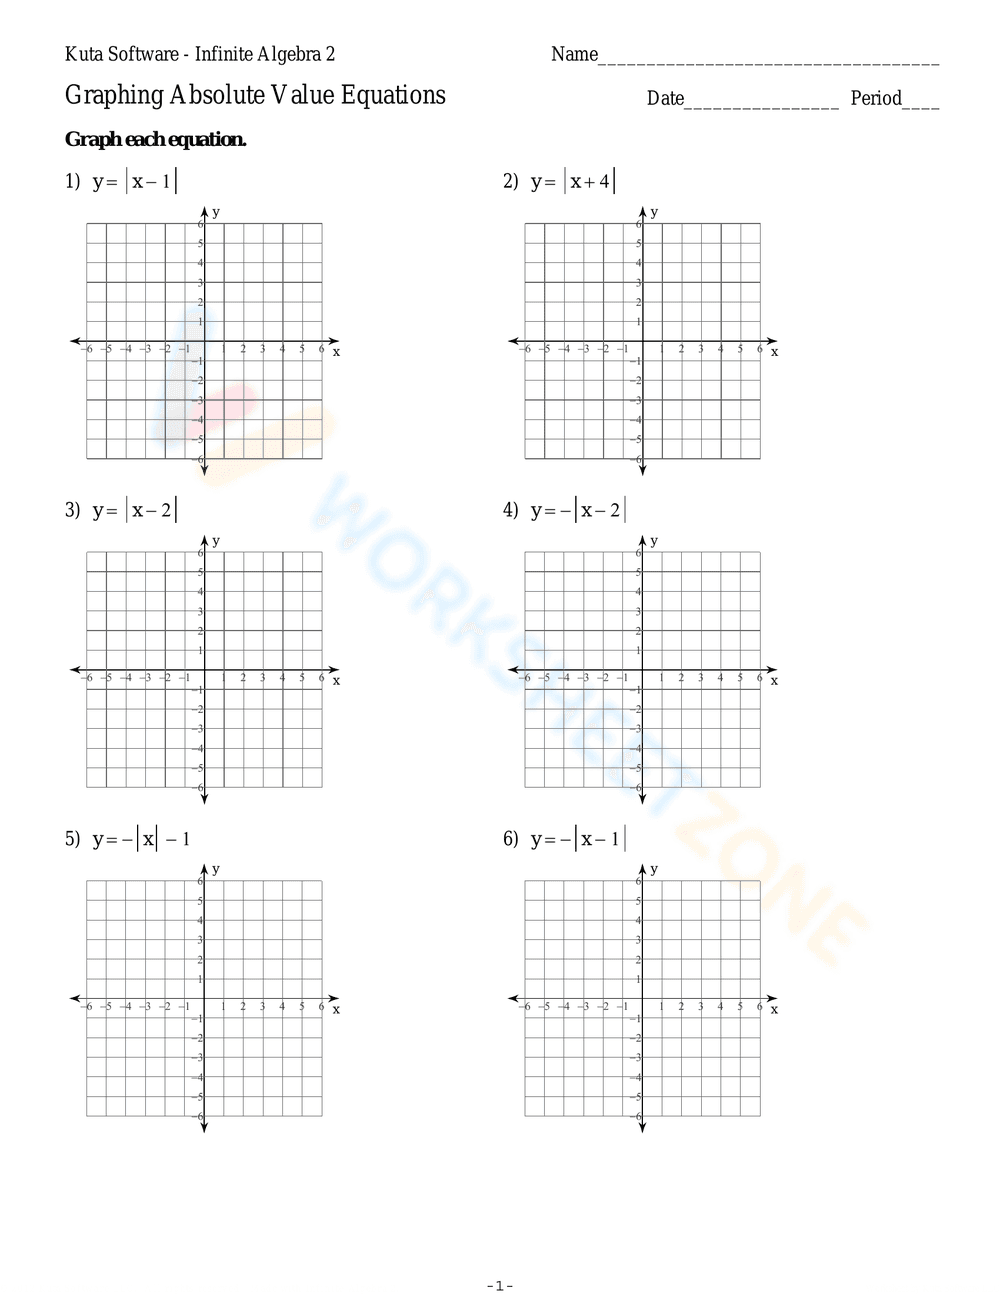
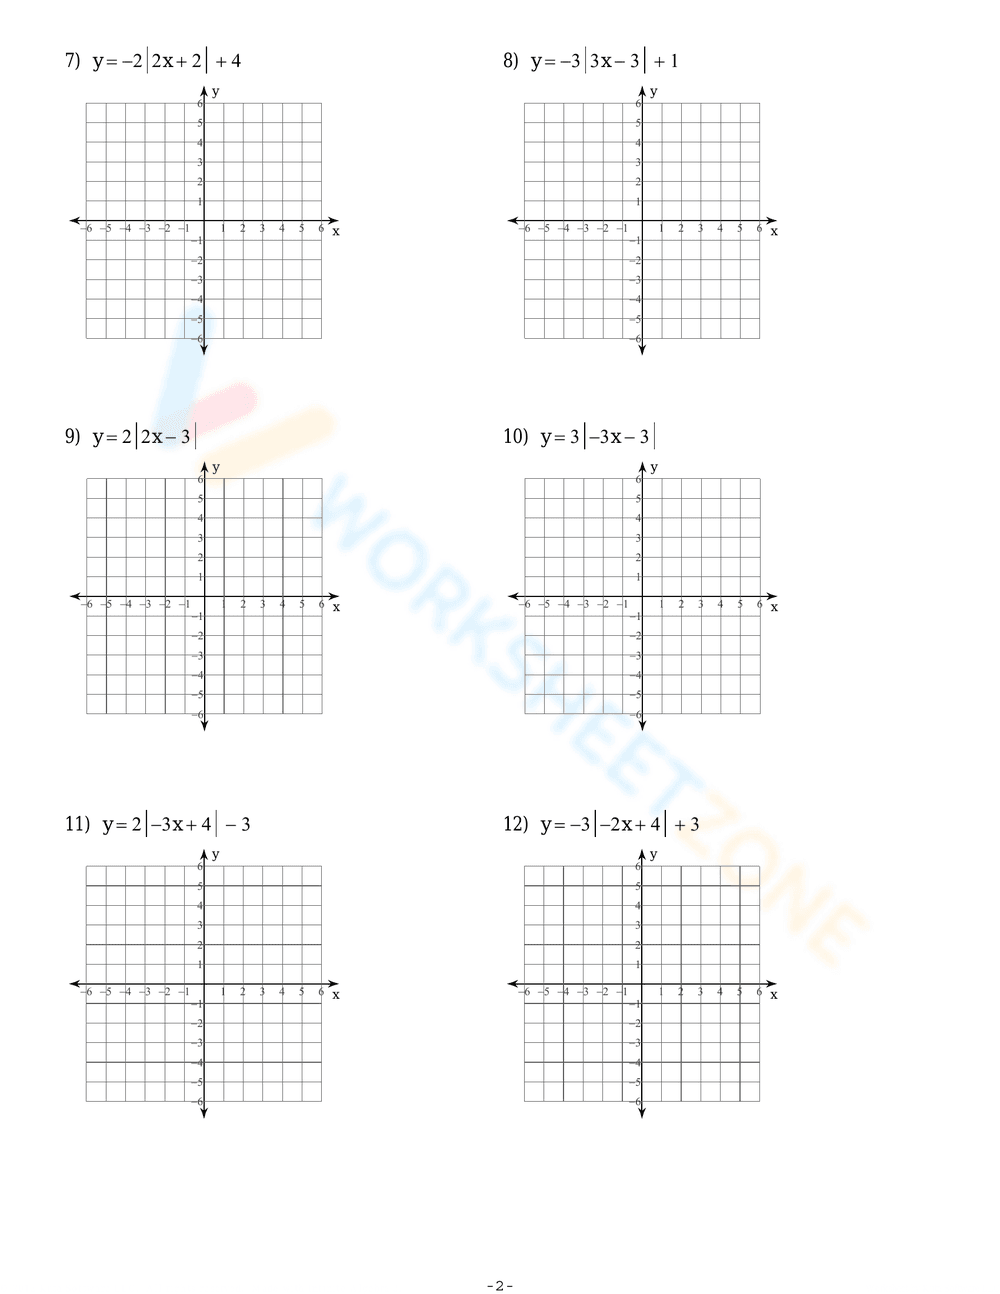
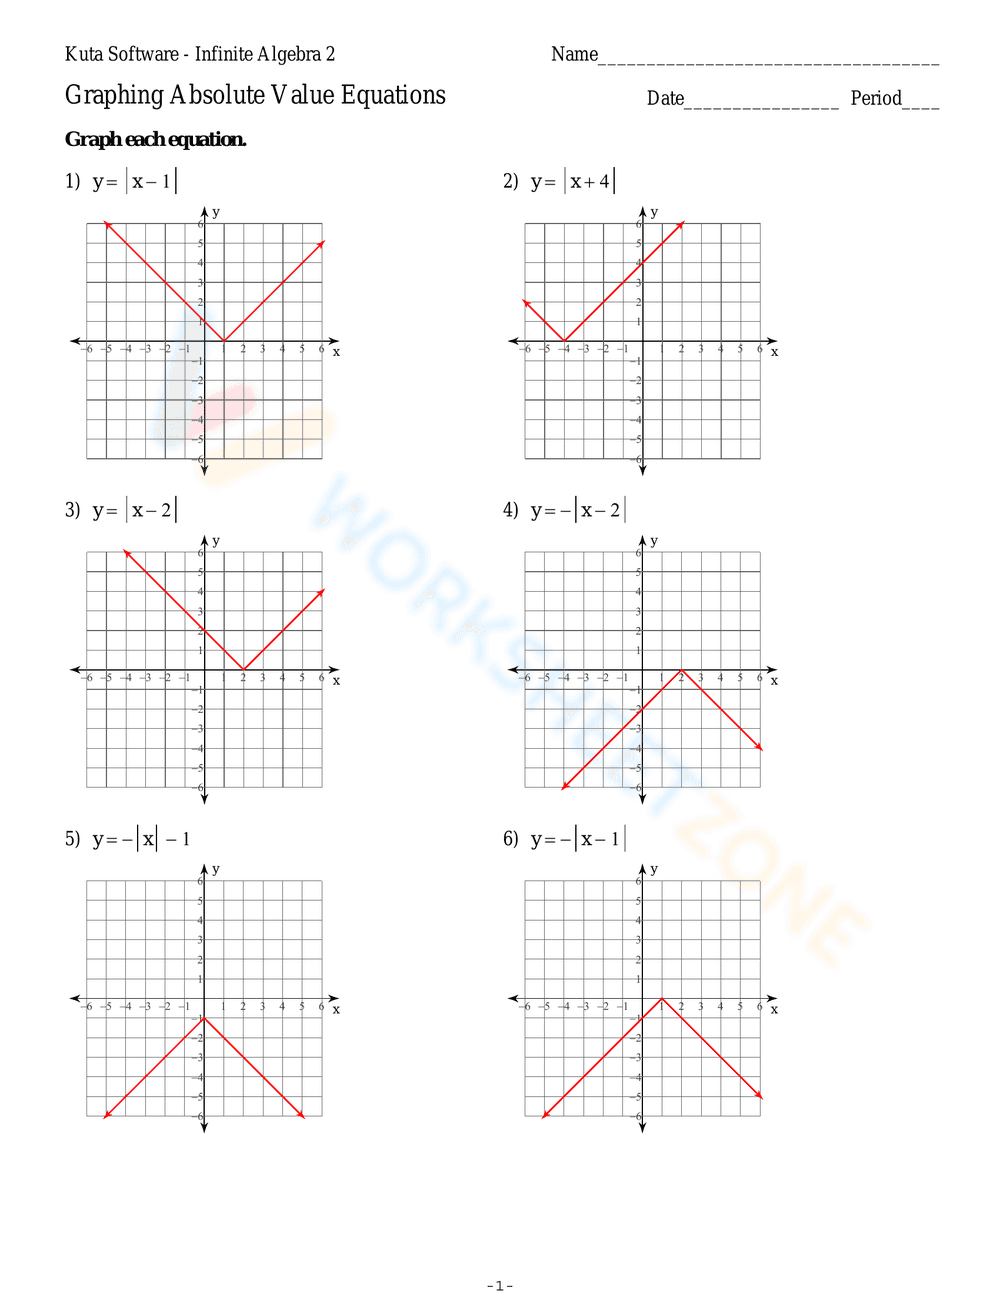
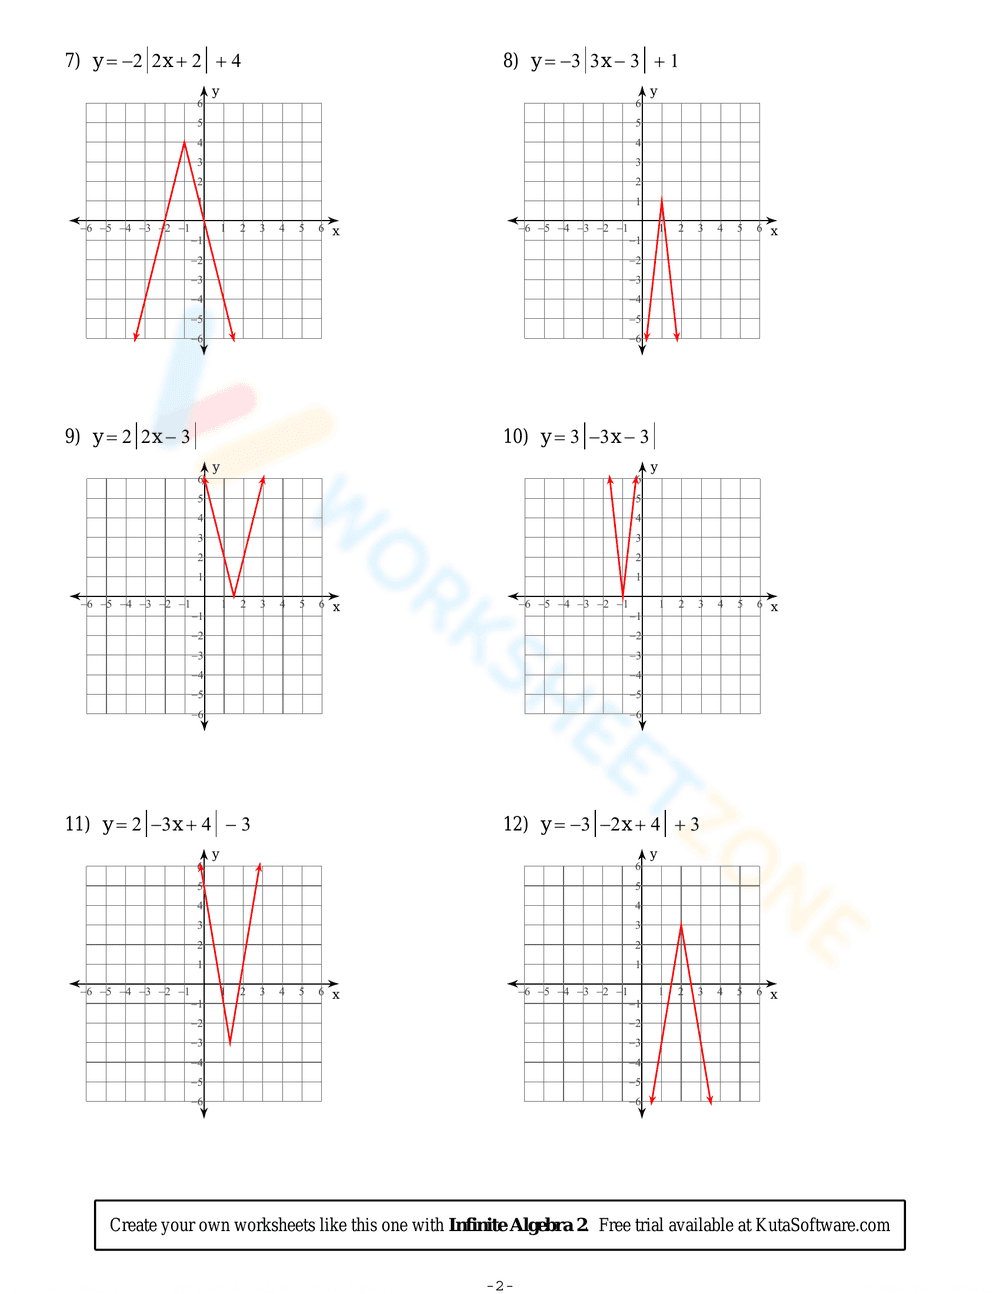
This is a worksheet titled 'Graphing Absolute Value Equations' from Kuta Software - Infinite Algebra 2. It presents six different absolute value equations for students to graph. Each problem is followed by a blank coordinate plane ready for graphing. The equations include variations like y = |x-1|, y = |x+4|, y = |x-2|, y = -|x-2|, y = -|x|-1, and y = -|x-1|. There are also fields for students to write their name, date, and period.
Grade Level Suitability:
This worksheet is suitable for Algebra 2, typically grades 10-12. It requires understanding of absolute value functions and their transformations, along with graphing skills on the coordinate plane.
Why Use It:
This worksheet provides practice in graphing absolute value functions and understanding how different transformations (horizontal shifts, vertical reflections, vertical shifts) affect the graph of the parent function y = |x|. It reinforces the connection between algebraic equations and their graphical representations.
How to Use It:
Students should analyze each absolute value equation and determine the vertex and any transformations applied to the parent function. Then, they should plot points and graph the equation on the provided coordinate plane.
Target Users:
The target users are Algebra 2 students who are learning about absolute value functions and their graphs. It's also suitable for teachers looking for practice problems for their students.