


1 / 2
0
Views
0
Downloads

0.0
0
0 Likes
Graphing Periodic Trends: A Chemistry Worksheet
0 Views
0 Downloads
Paste this activity's link or code into your existing LMS (Google Classroom, Canvas, Teams, Schoology, Moodle, etc.).
Students can open and work on the activity right away, with no student login required.
You'll still be able to track student progress and results from your teacher account.
Information
Description
What It Is:
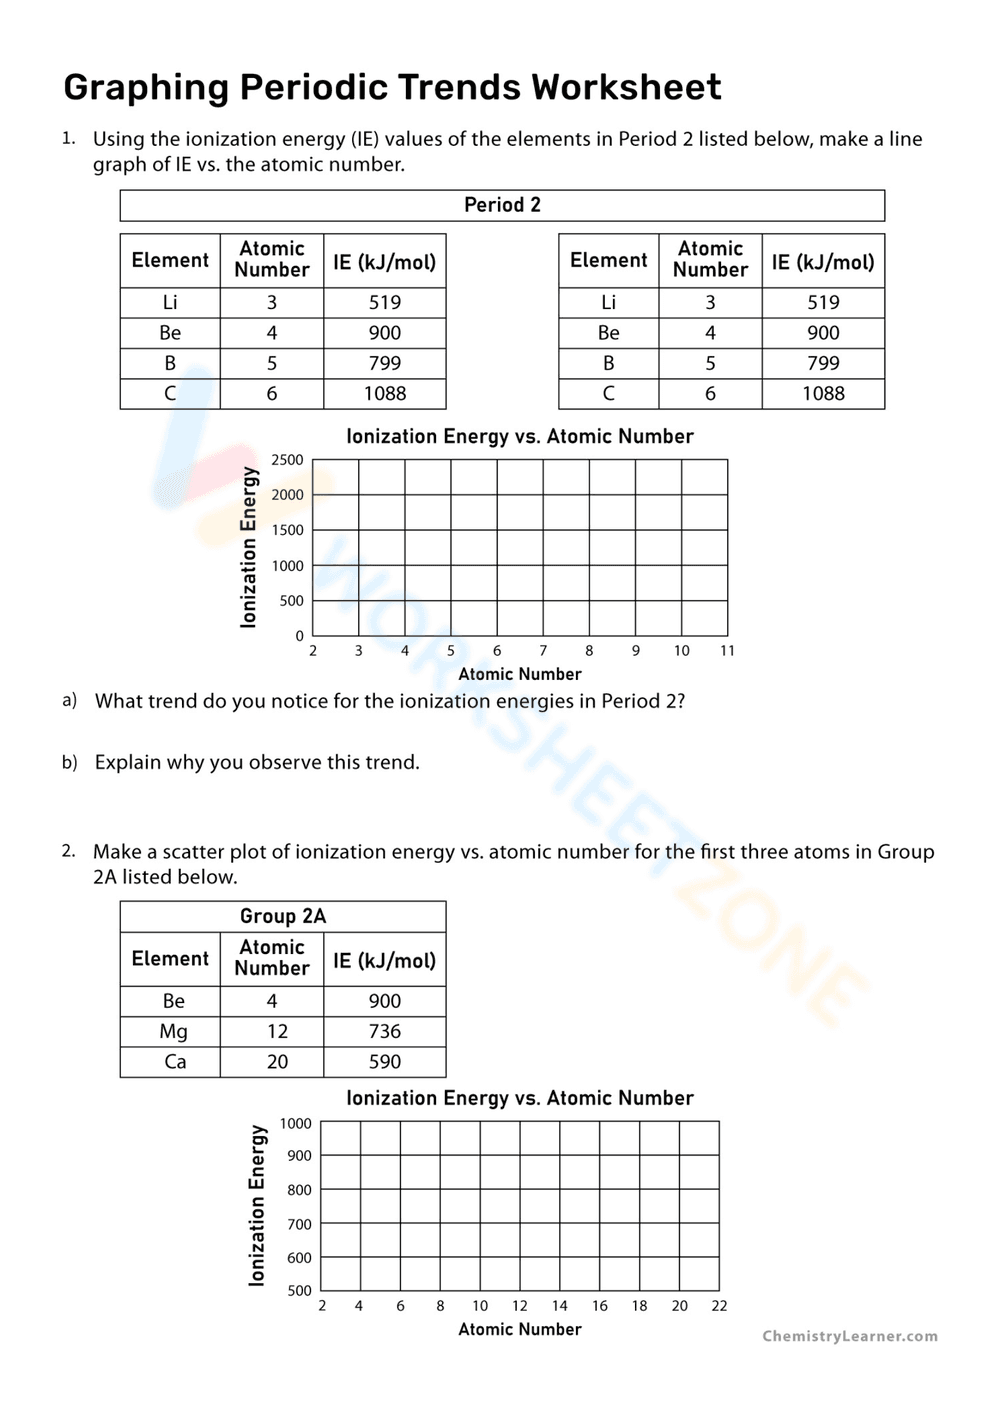
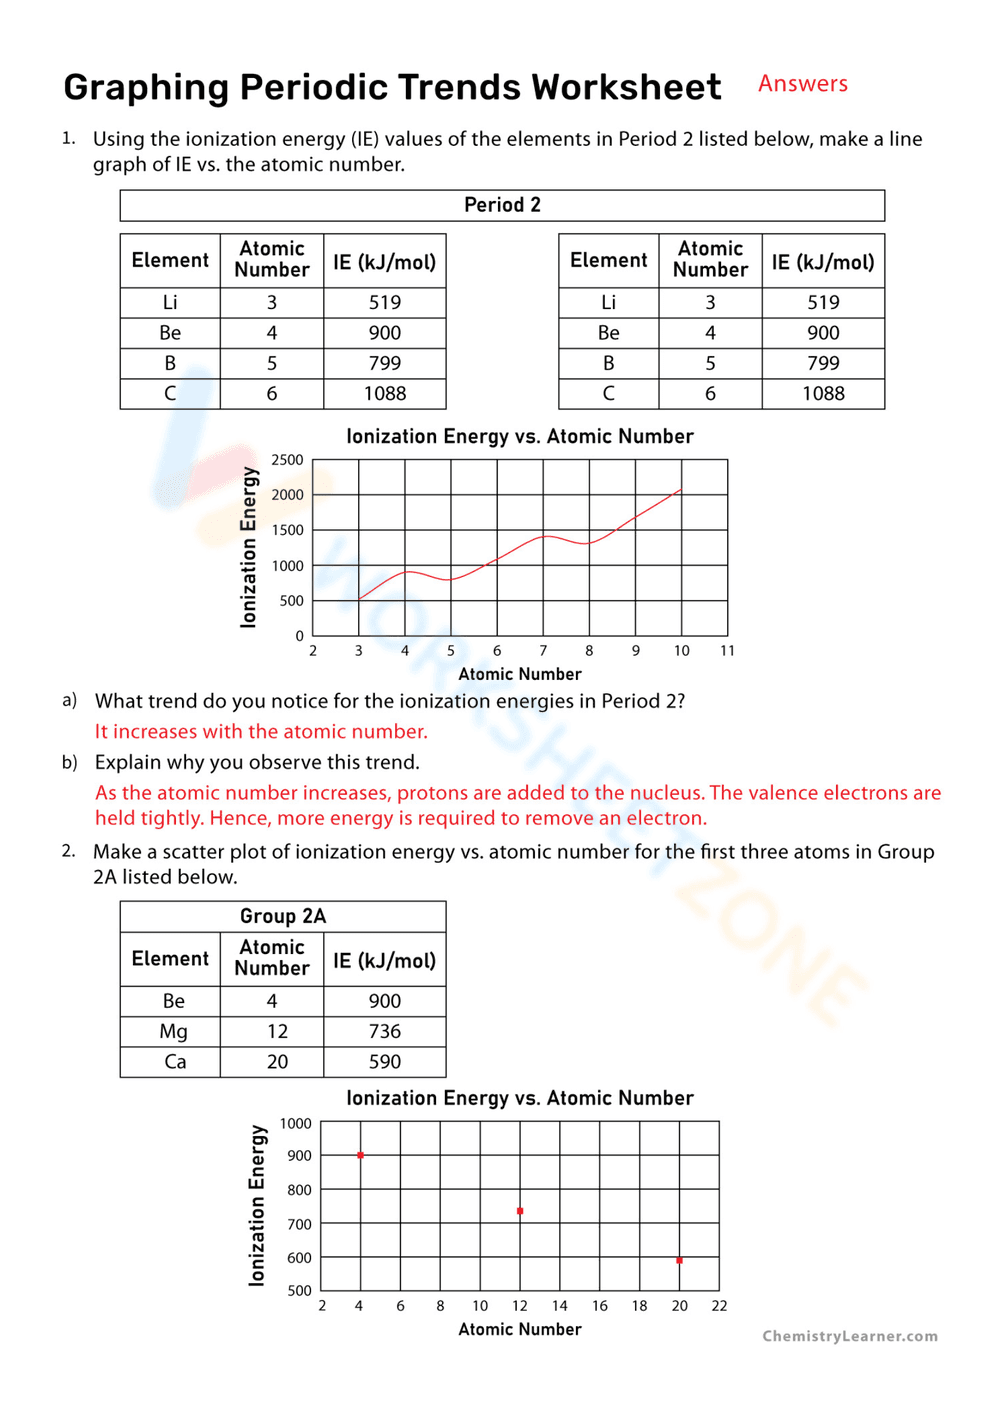
This is a chemistry worksheet focused on graphing periodic trends. It contains two exercises where students are given tables of elements, their atomic numbers, and ionization energies. The first exercise involves graphing the ionization energy vs. atomic number for elements in Period 2 and analyzing the trend. The second exercise involves creating a scatter plot of ionization energy vs. atomic number for the first three elements in Group 2A and analyzing the trend. Both exercises require students to plot data on provided graphs and answer questions about the observed trends.
Grade Level Suitability:
This worksheet is suitable for high school chemistry students, specifically grades 9-12. It requires an understanding of the periodic table, ionization energy, graphing techniques, and trend analysis, which are typically covered in high school chemistry courses.
Why Use It:
This worksheet helps students visualize and understand periodic trends, specifically ionization energy. It reinforces graphing skills, data analysis, and the relationship between atomic structure and chemical properties. By completing this worksheet, students can improve their ability to interpret data, identify trends, and explain scientific phenomena.
How to Use It:
Students should first read the instructions and examine the provided data tables. For each exercise, they need to plot the given data points on the provided graph, labeling the axes correctly. After plotting the data, they should connect the points for the first exercise and create a scatter plot for the second. Finally, they should analyze the resulting graphs and answer the questions about the observed trends in ionization energy.
Target Users:
The target users are high school chemistry students, particularly those learning about the periodic table and periodic trends. It is also useful for teachers looking for resources to reinforce these concepts and assess student understanding.