


1 / 10
0
Views
0
Downloads


0.0
0
0 Likes
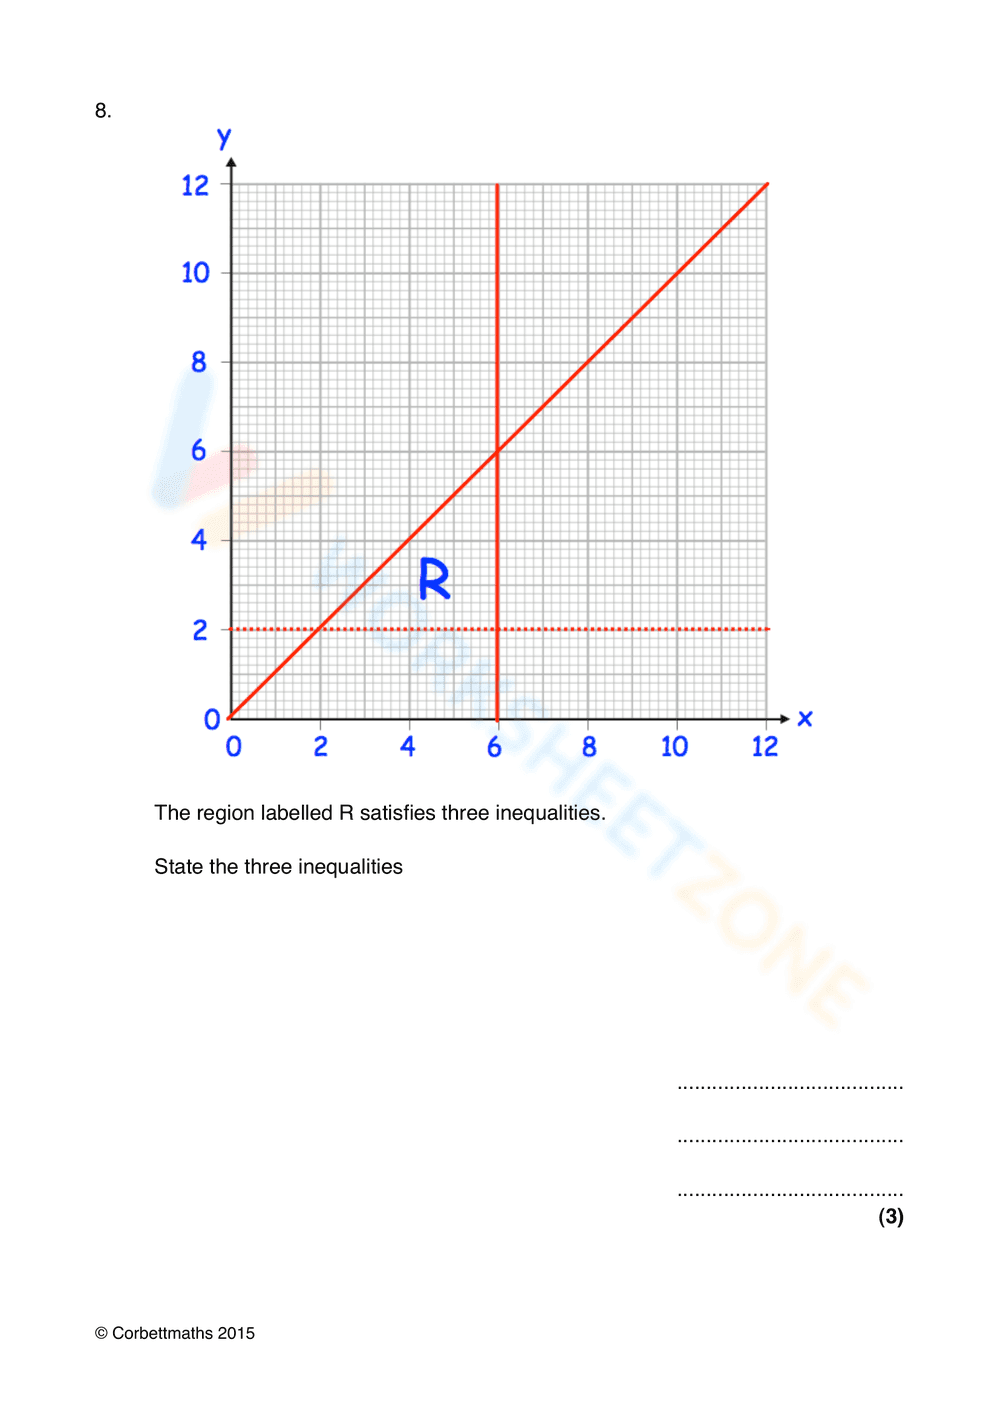
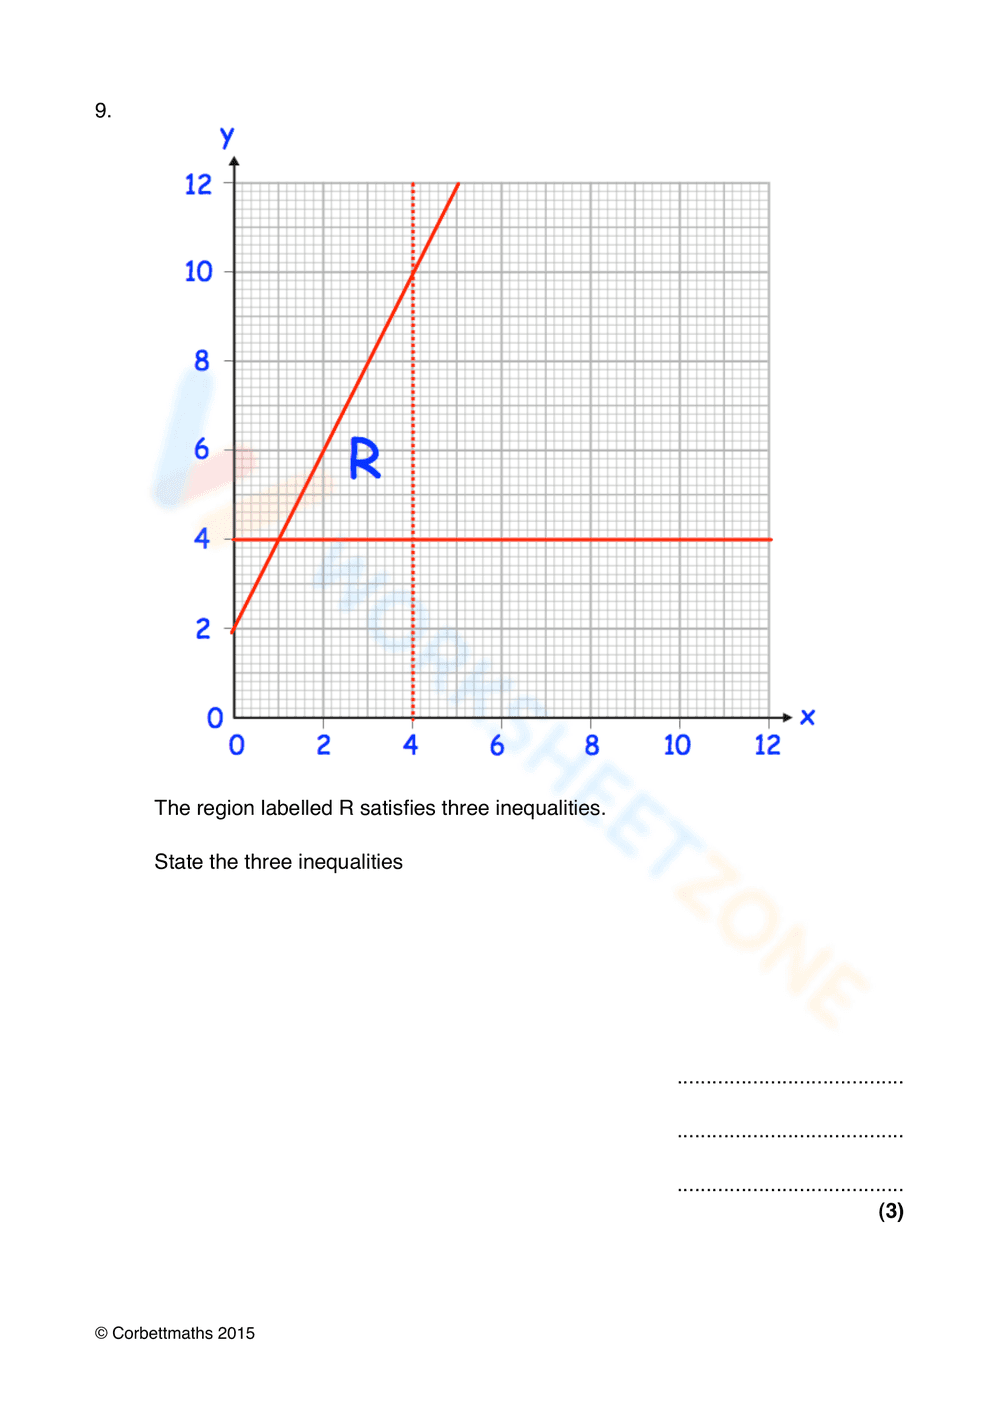
Graphing Systems of Linear Inequalities Worksheet
0 Views
0 Downloads
Paste this activity's link or code into your existing LMS (Google Classroom, Canvas, Teams, Schoology, Moodle, etc.).
Students can open and work on the activity right away, with no student login required.
You'll still be able to track student progress and results from your teacher account.
Information
Description
What It Is:
This is an exam-style mathematics worksheet focusing on 'Graphical Inequalities,' provided by Corbettmaths. It includes a space for the student's name, instructions to use tools like a pencil, ruler, protractor, compass, and eraser, and guidance on how to approach the questions (read carefully, don't spend too long, attempt every question, check answers, show workings). It also provides revision resources with a website link (www.corbettmaths.com/contents), QR code, and video numbers 180, 181, and 182.
Grade Level Suitability:
This worksheet is suitable for grades 9-11 (high school level), depending on the curriculum. The topic of graphical inequalities typically falls within algebra and pre-calculus courses. The 'exam style questions' suggest it's for students preparing for assessments.
Why Use It:
This worksheet helps students practice and reinforce their understanding of graphical inequalities. It encourages careful problem-solving, attention to detail, and the proper use of mathematical tools. The provided revision resources support independent learning and offer additional explanations and examples.
How to Use It:
Students should start by reading the guidance section. They need a pencil, pen, ruler, protractor, compass, and eraser. Students should attempt each question, showing all their workings. If they struggle, they can use the provided website link, QR code, or video numbers to review the topic.
Target Users:
The target users are high school students (grades 9-11) studying algebra or pre-calculus, particularly those preparing for exams or needing extra practice with graphical inequalities. Teachers can use it as a classroom activity, homework assignment, or revision tool.