


0
Views
0
Downloads

0.0
0
0 Likes
Understanding Heating Curves Worksheet
0 Views
0 Downloads
Paste this activity's link or code into your existing LMS (Google Classroom, Canvas, Teams, Schoology, Moodle, etc.).
Students can open and work on the activity right away, with no student login required.
You'll still be able to track student progress and results from your teacher account.
Information
Description
What It Is:
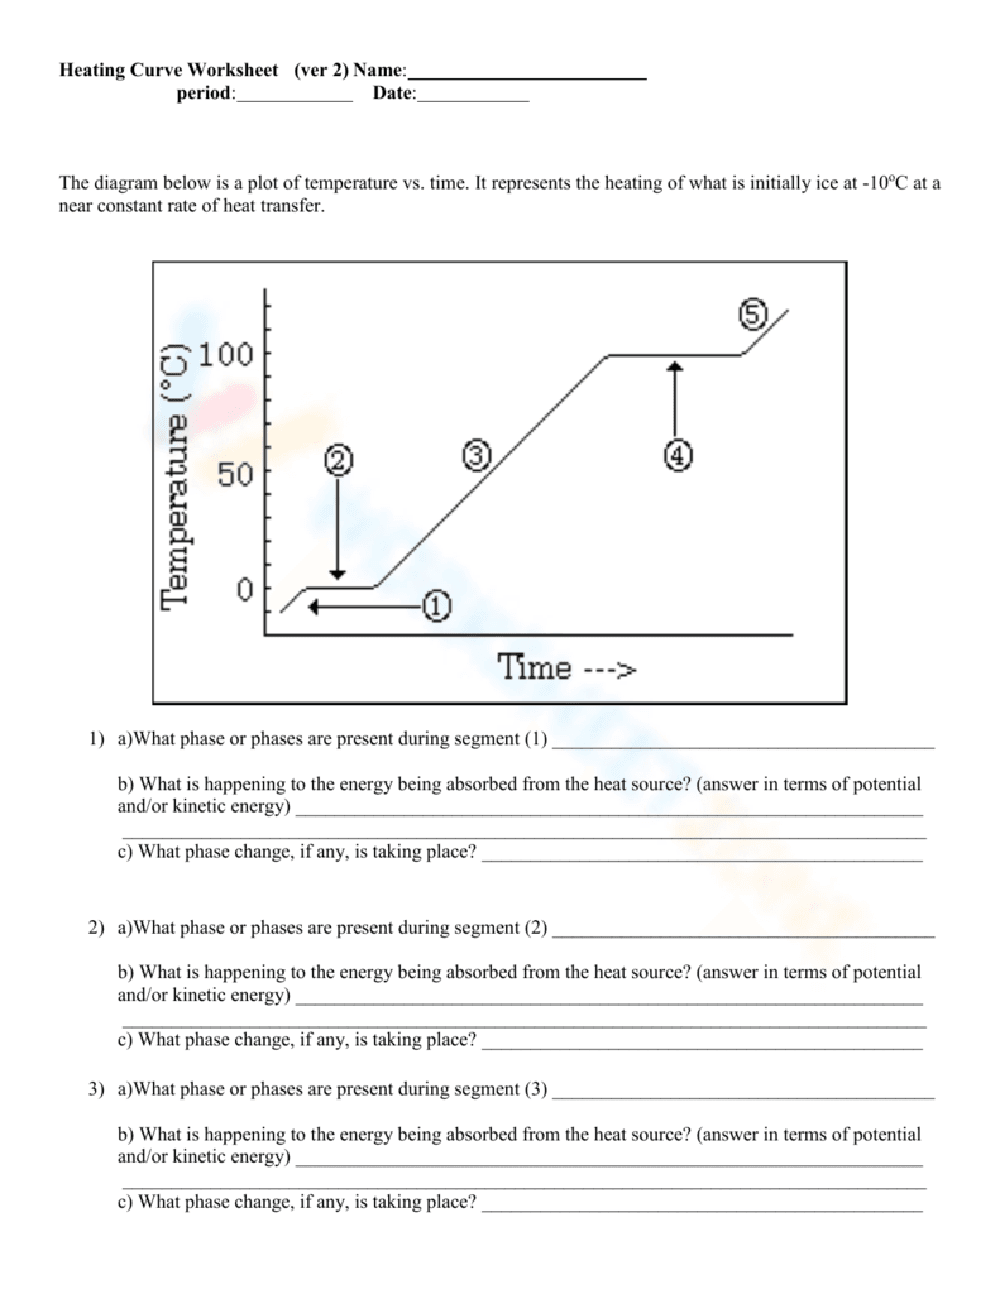
This is a chemistry worksheet focusing on heating curves. It presents a graph of temperature vs. time, illustrating the heating of a substance initially at -10°C. The graph is divided into five numbered regions (1-5), each representing a different phase or phase change. Below the graph are three questions for each region, prompting students to identify the phase(s) present, describe what happens to the energy being absorbed, and state what phase change, if any, is occurring.
Grade Level Suitability:
This worksheet is suitable for high school students, typically in grades 9-12, studying chemistry or physical science. The concepts of phase changes, energy absorption, and heating curves are generally introduced at this level.
Why Use It:
This worksheet reinforces understanding of heating curves and phase transitions. It helps students connect the visual representation of a heating curve with the underlying processes of energy absorption and phase changes (solid, liquid, gas). It promotes critical thinking by requiring students to analyze the graph and apply their knowledge of thermodynamics.
How to Use It:
Students should first carefully examine the heating curve graph. Then, for each numbered region (1-5), they should answer the three corresponding questions. They need to identify the phase or phases present (solid, liquid, gas, or combinations), explain how the energy is being used (increasing kinetic energy or potential energy during phase change), and state the specific phase change, if any, that is taking place (e.g., melting, boiling).
Target Users:
The target users are high school students taking chemistry or physical science courses. It is also helpful for teachers looking for supplemental materials to teach and assess student understanding of heating curves and phase changes.