


0
Views
0
Downloads

0 Likes
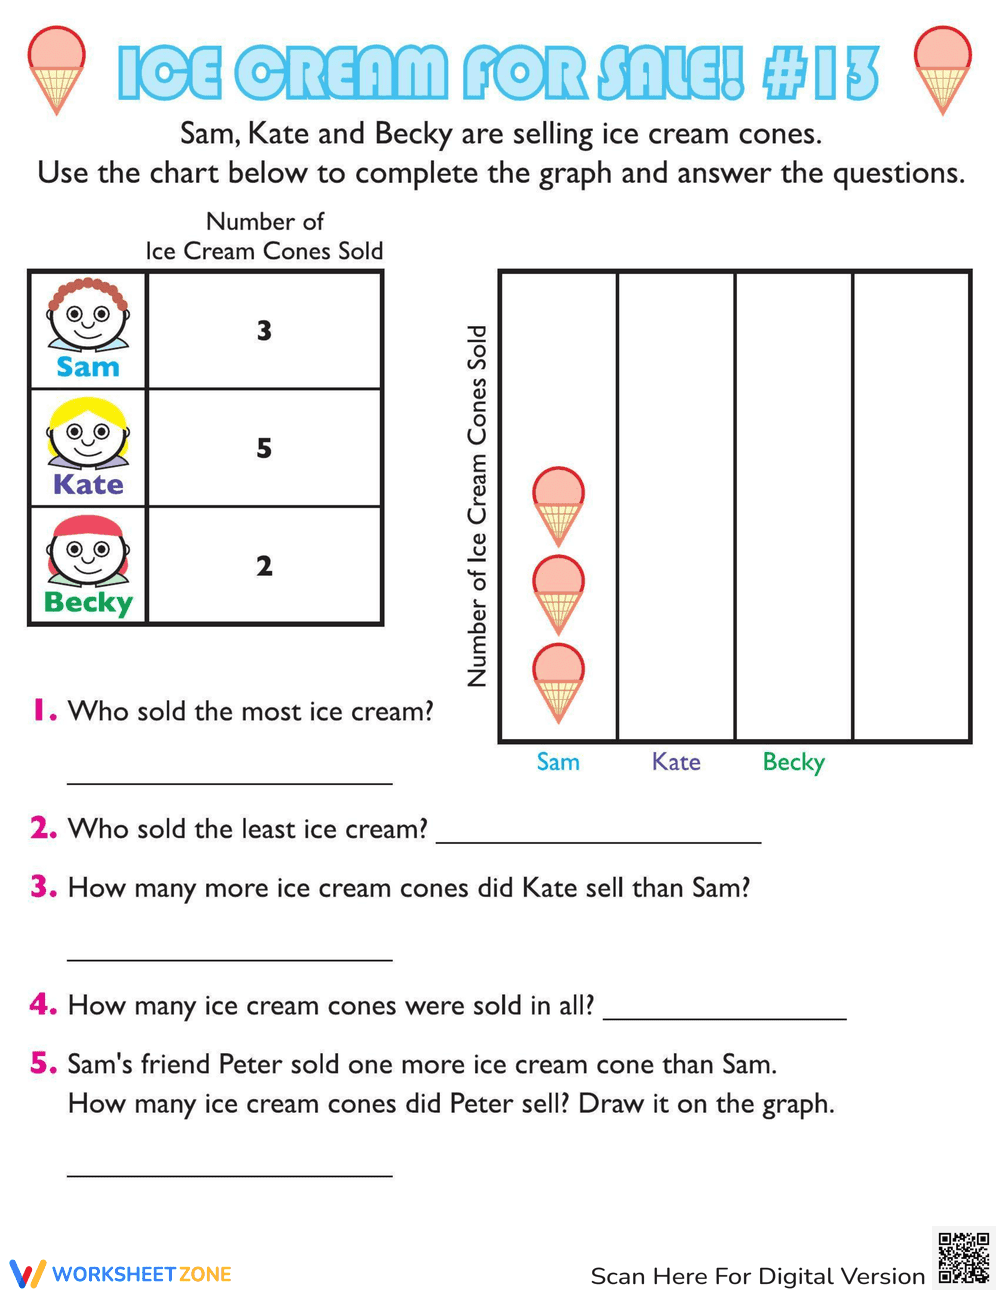
Ice Cream Graph #13
0 Views
0 Downloads
Paste this activity's link or code into your existing LMS (Google Classroom, Canvas, Teams, Schoology, Moodle, etc.).
Students can open and work on the activity right away, with no student login required.
You'll still be able to track student progress and results from your teacher account.
Information
Description
Practice graphing data with Sam, Kate and Becky as they sell ice cream cones! Your child will keep track of their sales by drawing in the data to finish this pictograph, and then use the graph to help answer a few math questions.