


0
Views
0
Downloads

0 Likes
Bar Graph Reading and Analysis
0 Views
0 Downloads
Paste this activity's link or code into your existing LMS (Google Classroom, Canvas, Teams, Schoology, Moodle, etc.).
Students can open and work on the activity right away, with no student login required.
You'll still be able to track student progress and results from your teacher account.
Information
Description
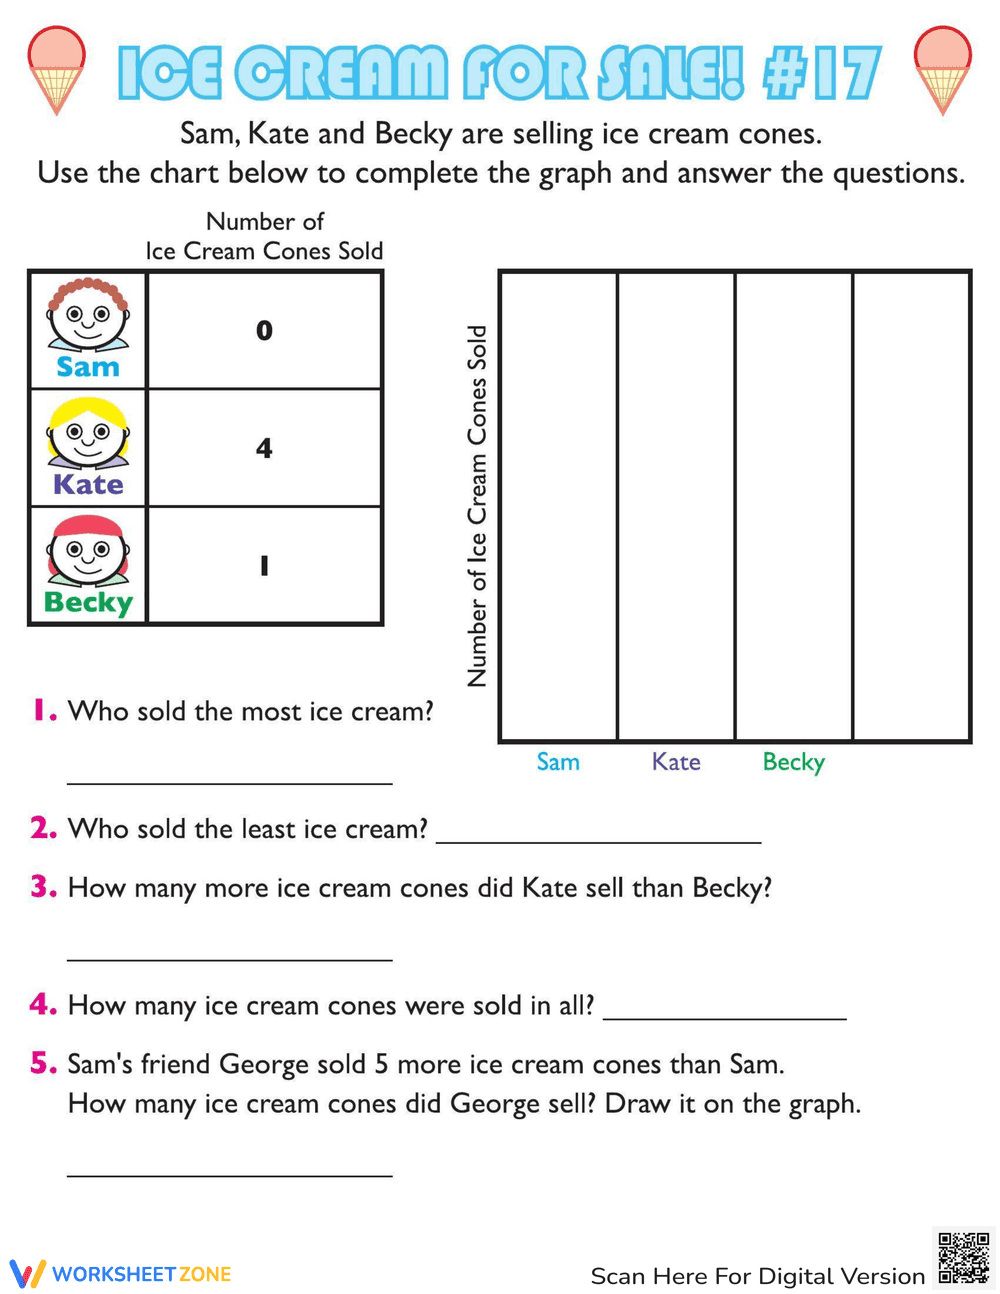
What It Is:
This is an educational worksheet titled 'Ice Cream for Sale! #17'. It features a chart showing the number of ice cream cones sold by Sam (0), Kate (4), and Becky (1). Students are instructed to use this data to complete a bar graph and answer five word problems related to the ice cream sales. The worksheet includes space for students to draw on the graph and write their answers.
Grade Level Suitability:
This worksheet is suitable for grades 1-3. The content involves basic data interpretation, graph completion, and simple addition/subtraction word problems, which align with the math skills taught in these grade levels.
Why Use It:
This worksheet helps students develop data analysis skills, practice creating bar graphs, and improve their problem-solving abilities with real-world scenarios. It reinforces addition and subtraction skills within the context of an engaging activity.
How to Use It:
First, students should use the data provided in the chart to fill in the bar graph for Sam, Kate, and Becky. Then, they should answer the five word problems using the information from the chart and graph. For question 5, they need to calculate how many ice cream cones George sold and draw a bar representing that amount on the graph.
Target Users:
This worksheet is ideal for elementary school students in grades 1-3 who are learning about data representation, graphing, and basic arithmetic. It can be used in the classroom, as homework, or for supplemental learning at home.