


0
Views
0
Downloads

0.0
0
0 Likes
Interpreting Linear Equations Worksheet
0 Views
0 Downloads
Paste this activity's link or code into your existing LMS (Google Classroom, Canvas, Teams, Schoology, Moodle, etc.).
Students can open and work on the activity right away, with no student login required.
You'll still be able to track student progress and results from your teacher account.
Information
Description
What It Is:
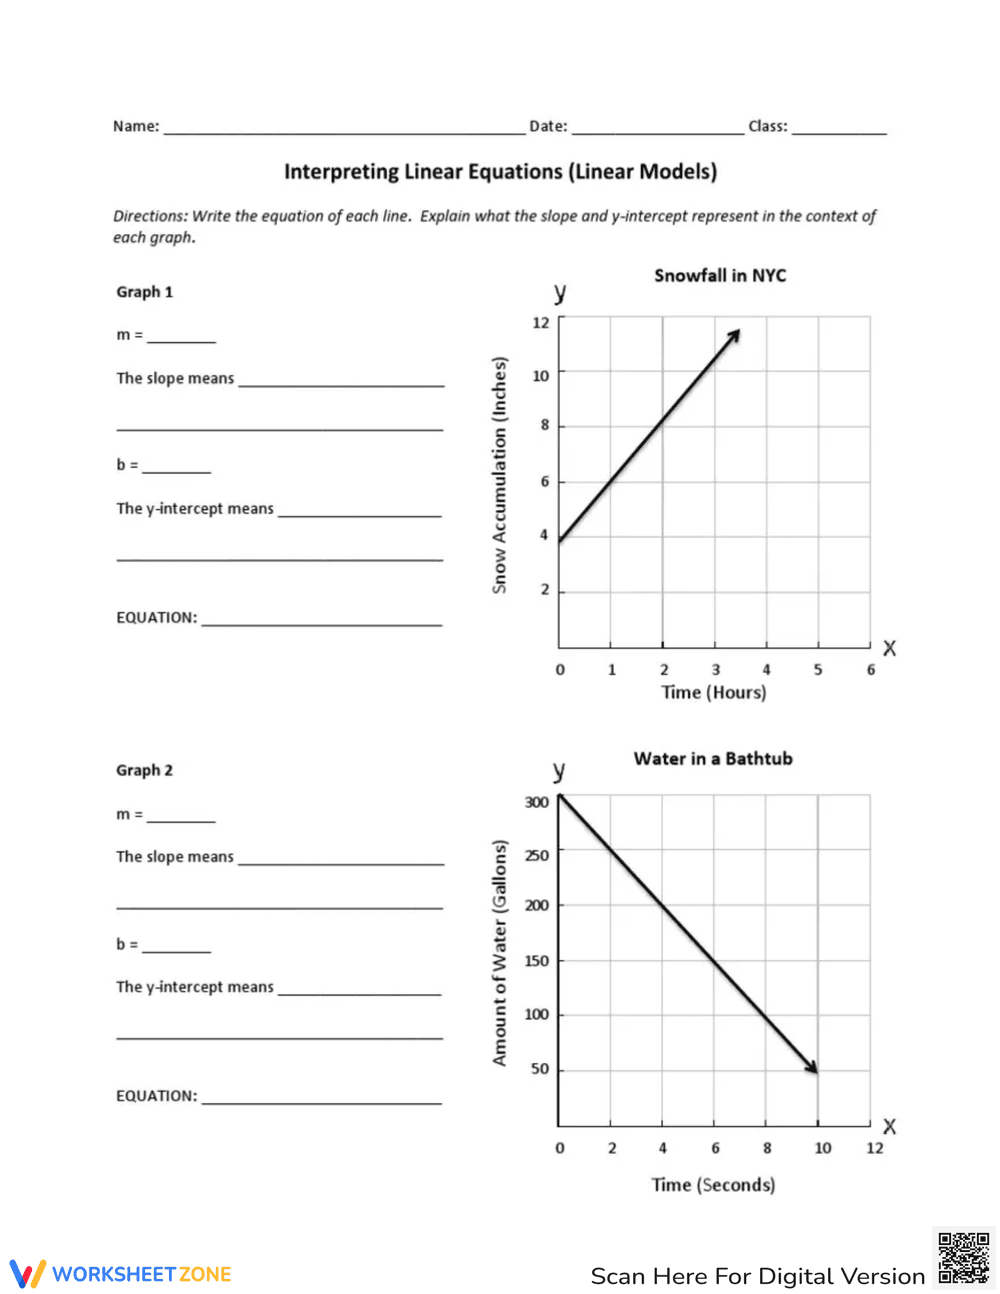
This is a worksheet focused on interpreting linear equations within linear models. It presents two graphs: one showing snowfall accumulation in NYC over time and the other showing the amount of water in a bathtub draining over time. For each graph, the worksheet asks students to determine the slope (m), what the slope means in context, the y-intercept (b), what the y-intercept means in context, and finally to write the equation of the line.
Grade Level Suitability:
This worksheet is suitable for grades 8-10. It requires an understanding of linear equations, slope, y-intercept, and the ability to interpret graphs within a real-world context. It assumes students have prior knowledge of coordinate planes and linear relationships.
Why Use It:
This worksheet helps students connect abstract mathematical concepts (slope, y-intercept, linear equations) to real-world situations. It reinforces the ability to read and interpret graphs, and encourages critical thinking by asking students to explain the meaning of slope and y-intercept in the context of each graph.
How to Use It:
Students should first analyze each graph to determine the slope and y-intercept. They should then use these values to write the equation of the line. Finally, they should explain what the slope and y-intercept represent in the context of the snowfall and bathtub examples, using appropriate units.
Target Users:
This worksheet is ideal for students learning about linear equations and their applications. It is also useful for students who need practice interpreting graphs and connecting mathematical concepts to real-world scenarios. Teachers can use it as a classroom activity, homework assignment, or assessment tool.