


1 / 2
0
Views
0
Downloads

0.0
0
0 Likes
Write & Interpret Lines of Best Fit Equations
0 Views
0 Downloads
Paste this activity's link or code into your existing LMS (Google Classroom, Canvas, Teams, Schoology, Moodle, etc.).
Students can open and work on the activity right away, with no student login required.
You'll still be able to track student progress and results from your teacher account.
Information
Description
What It Is:
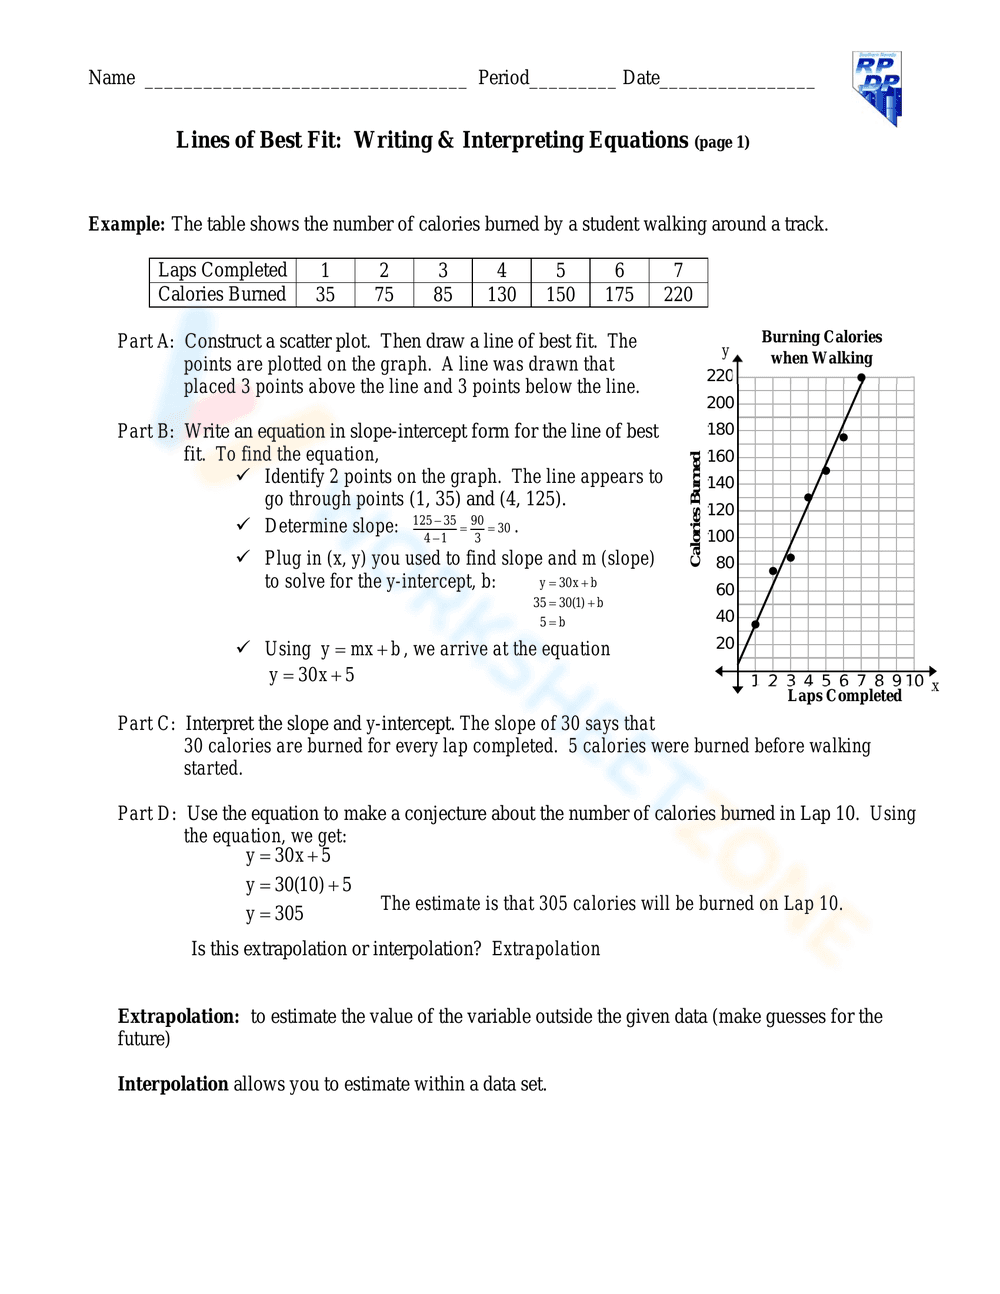
This is an educational worksheet focused on lines of best fit. It includes a table showing calories burned by a student walking around a track based on laps completed. The worksheet guides students to construct a scatter plot, draw a line of best fit, write an equation in slope-intercept form, interpret the slope and y-intercept in context, and use the equation to make a conjecture about calorie burn for a lap outside the given data (extrapolation). It also defines extrapolation and interpolation.
Grade Level Suitability:
This worksheet is suitable for grades 8-10, specifically Algebra 1. It requires understanding of scatter plots, linear equations, slope-intercept form, and interpreting graphs in real-world contexts. The concepts of extrapolation and interpolation are also introduced.
Why Use It:
This worksheet helps students connect algebra concepts to real-world data. It reinforces skills in creating scatter plots, finding lines of best fit, writing linear equations, and interpreting the meaning of slope and y-intercept. It also introduces the concept of extrapolation for making predictions beyond the given data.
How to Use It:
Students should first construct the scatter plot using the data provided. Then, they draw a line of best fit, ensuring roughly equal points above and below the line. They then identify two points on the line to calculate the slope. Using the slope and one of the points, they determine the y-intercept and write the equation in slope-intercept form. Finally, they interpret the slope and y-intercept in the context of the problem and use the equation to estimate calorie burn for lap 10.
Target Users:
This worksheet is designed for students learning about lines of best fit, linear equations, and data analysis in an Algebra 1 or similar math course. It's also useful for students who need practice interpreting graphs and applying mathematical models to real-world scenarios.