


1 / 4
0
Views
0
Downloads


0.0
0
0 Likes
Updated Lines of Best Fit and Linear Regression
0 Views
0 Downloads
Paste this activity's link or code into your existing LMS (Google Classroom, Canvas, Teams, Schoology, Moodle, etc.).
Students can open and work on the activity right away, with no student login required.
You'll still be able to track student progress and results from your teacher account.
Information
Description
What It Is:
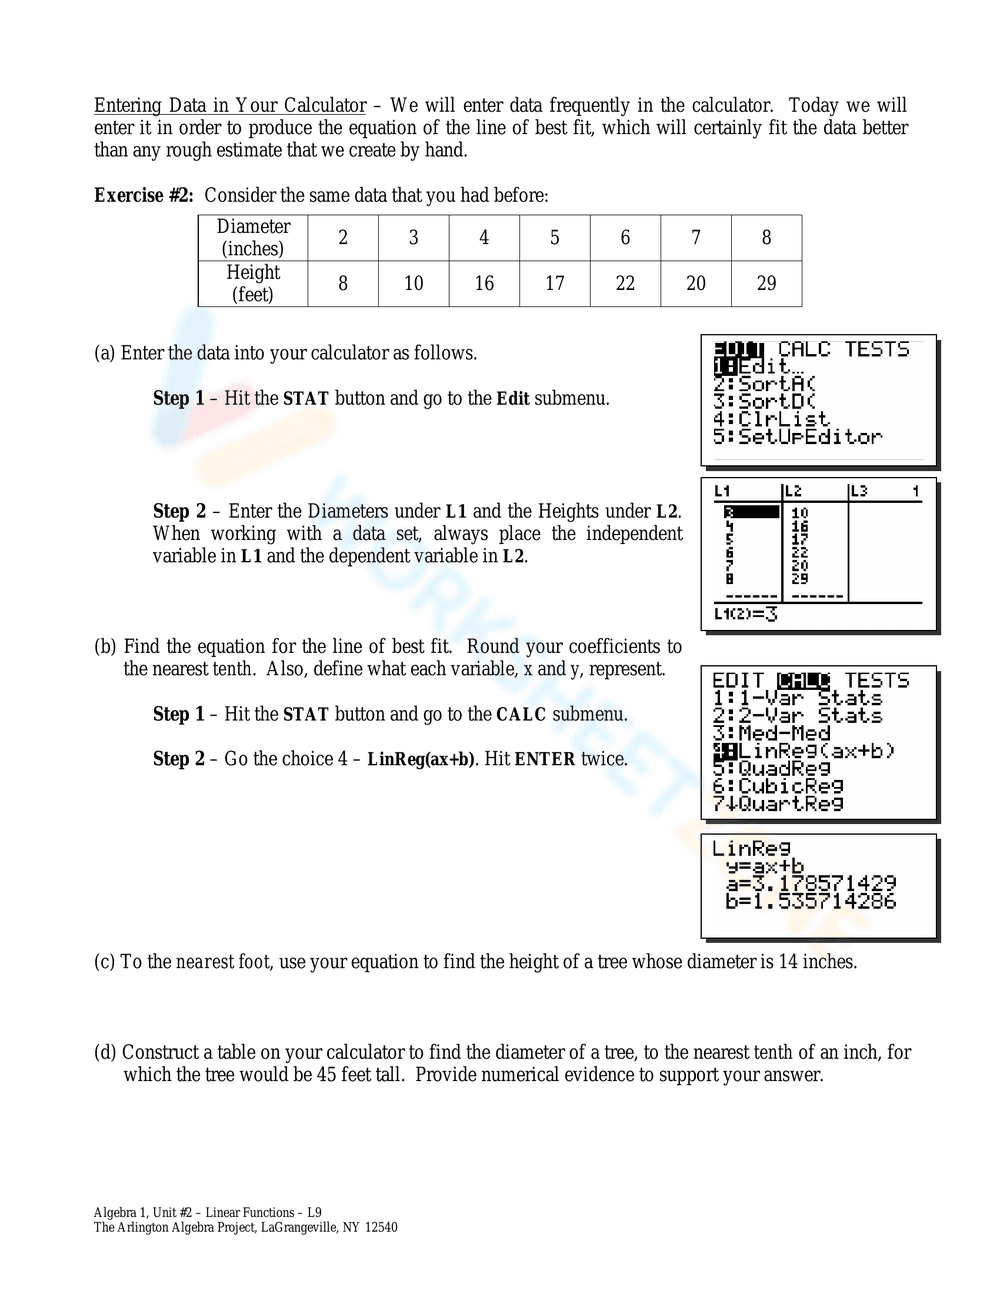
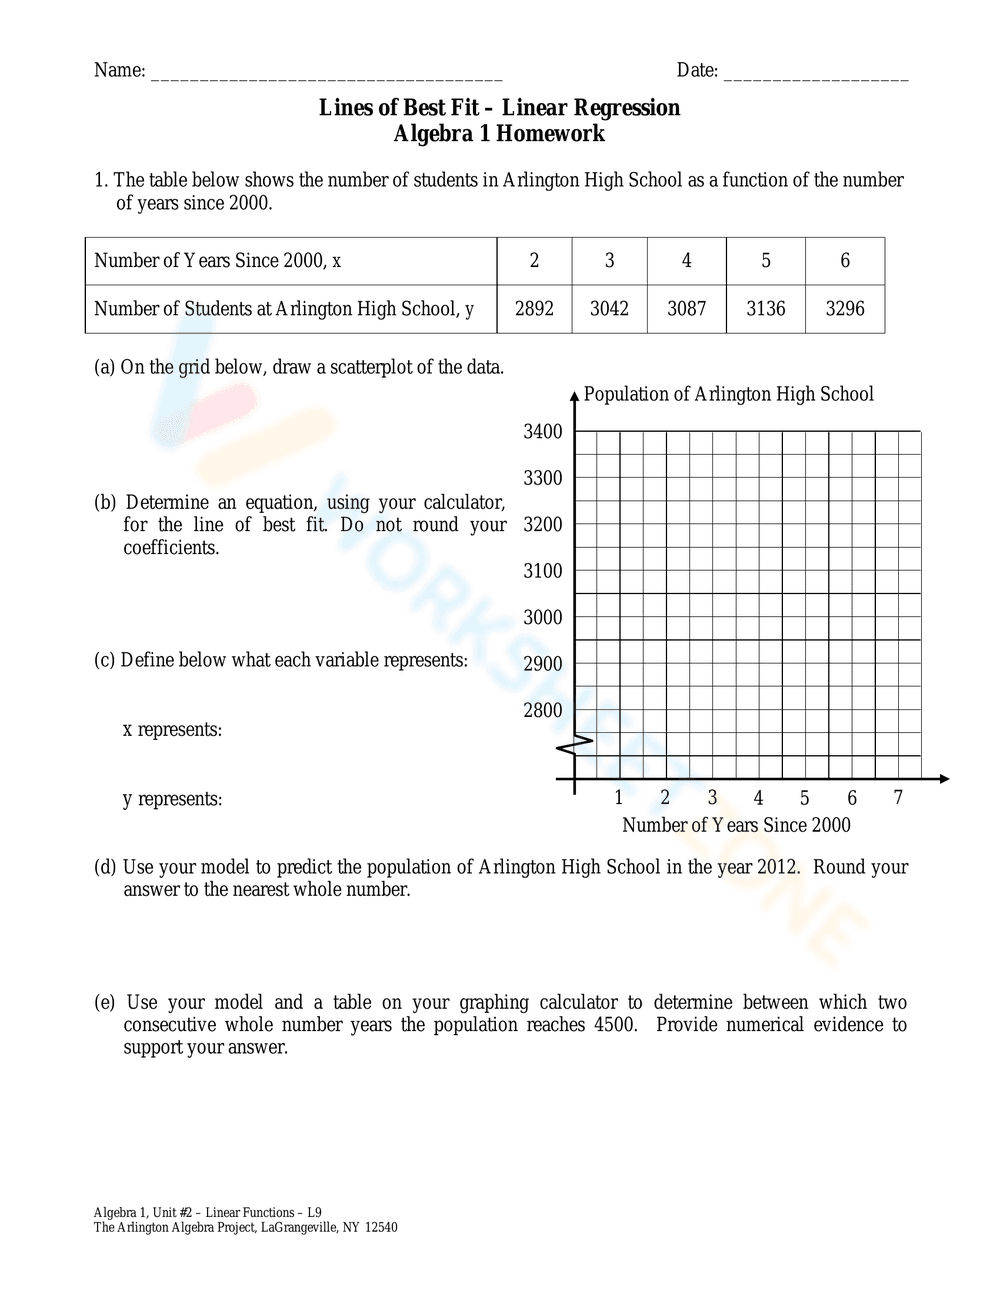
This is an Algebra 1 worksheet focused on linear regression and lines of best fit. It presents a scenario where a biologist is studying the relationship between a tree's diameter and its height. Students are given a table of data and instructed to create a scatterplot on a provided grid, draw a line of best fit, identify two ordered pairs on the line, determine the equation of the linear function, and extrapolate to estimate the height of a tree with a given diameter.
Grade Level Suitability:
This worksheet is suitable for 8th or 9th grade students in Algebra 1. It requires understanding of coordinate planes, scatterplots, linear equations, and the concept of a line of best fit. The extrapolation exercise adds a layer of complexity appropriate for this grade level.
Why Use It:
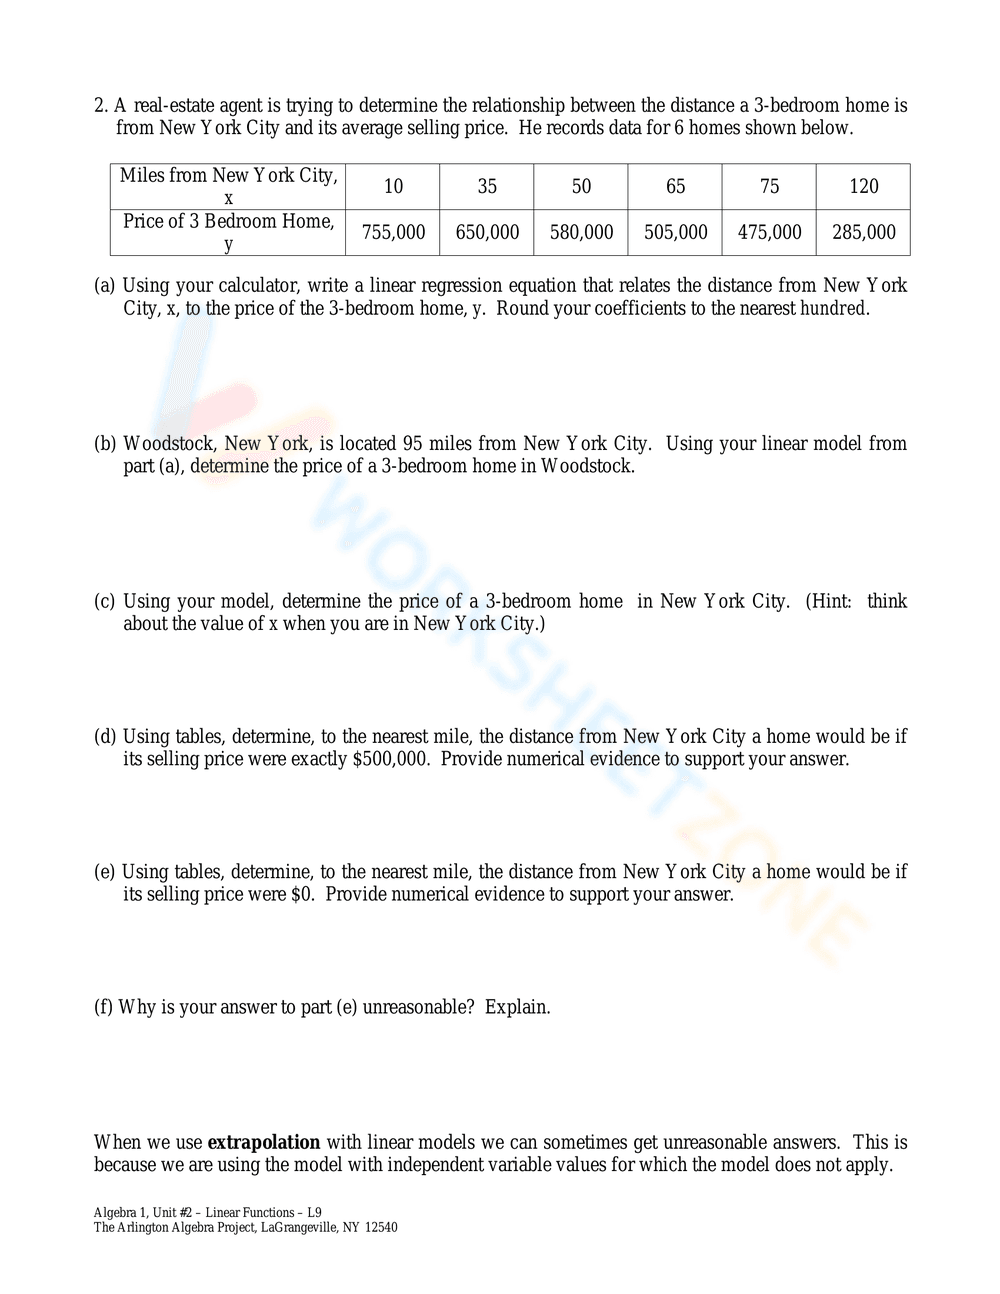
This worksheet helps students develop skills in data analysis, graphical representation, and linear modeling. It reinforces the concept of a line of best fit as an approximation of a real-world relationship and introduces the idea of extrapolation. Students learn to connect data to a visual representation and then to an algebraic equation.
How to Use It:
Students should first plot the given data points on the provided grid to create a scatterplot. Then, they should draw a line of best fit that visually represents the trend in the data, ensuring approximately equal numbers of points above and below the line. Next, they should select two points on their line of best fit and use these points to calculate the slope and y-intercept of the line, thus determining the equation. Finally, they can use the equation to estimate the height of a tree with a diameter of 14 inches, demonstrating extrapolation.
Target Users:
This worksheet is designed for Algebra 1 students learning about linear regression, scatterplots, and lines of best fit. It is also useful for teachers looking for practical exercises to reinforce these concepts and assess student understanding.
This is an Algebra 1 worksheet focused on linear regression and lines of best fit. It presents a scenario where a biologist is studying the relationship between a tree's diameter and its height. Students are given a table of data and instructed to create a scatterplot on a provided grid, draw a line of best fit, identify two ordered pairs on the line, determine the equation of the linear function, and extrapolate to estimate the height of a tree with a given diameter.
Grade Level Suitability:
This worksheet is suitable for 8th or 9th grade students in Algebra 1. It requires understanding of coordinate planes, scatterplots, linear equations, and the concept of a line of best fit. The extrapolation exercise adds a layer of complexity appropriate for this grade level.
Why Use It:
This worksheet helps students develop skills in data analysis, graphical representation, and linear modeling. It reinforces the concept of a line of best fit as an approximation of a real-world relationship and introduces the idea of extrapolation. Students learn to connect data to a visual representation and then to an algebraic equation.
How to Use It:
Students should first plot the given data points on the provided grid to create a scatterplot. Then, they should draw a line of best fit that visually represents the trend in the data, ensuring approximately equal numbers of points above and below the line. Next, they should select two points on their line of best fit and use these points to calculate the slope and y-intercept of the line, thus determining the equation. Finally, they can use the equation to estimate the height of a tree with a diameter of 14 inches, demonstrating extrapolation.
Target Users:
This worksheet is designed for Algebra 1 students learning about linear regression, scatterplots, and lines of best fit. It is also useful for teachers looking for practical exercises to reinforce these concepts and assess student understanding.