


0
Views
0
Downloads

0 Likes
Explore Two Representations Worksheet
0 Views
0 Downloads
Paste this activity's link or code into your existing LMS (Google Classroom, Canvas, Teams, Schoology, Moodle, etc.).
Students can open and work on the activity right away, with no student login required.
You'll still be able to track student progress and results from your teacher account.
Information
Description
What It Is:
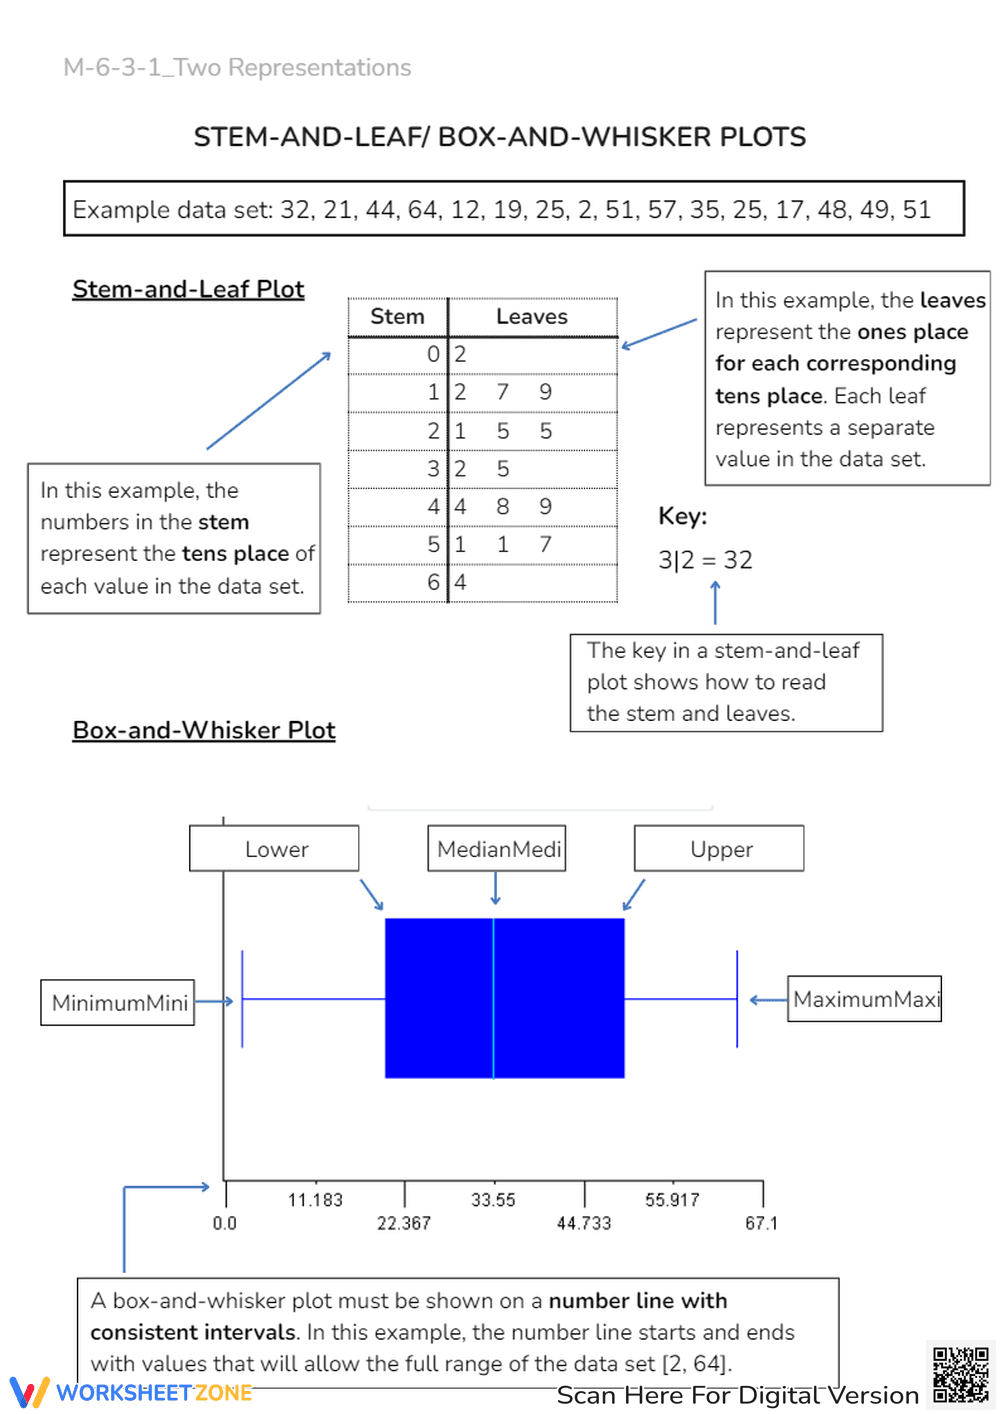
This is an educational worksheet demonstrating how to create and interpret stem-and-leaf plots and box-and-whisker plots. It provides an example dataset (32, 21, 44, 64, 12, 19, 25, 2, 51, 57, 35, 25, 17, 48, 49, 51) and shows how the data can be represented in both a stem-and-leaf plot and a box-and-whisker plot. The stem-and-leaf plot is organized with stems and leaves and includes a key to show how to read the plot (3|2 = 32). The box-and-whisker plot is shown on a number line with labeled minimum, lower quartile, median, upper quartile, and maximum values.
Grade Level Suitability:
This worksheet is suitable for grades 6-8. It introduces and explains the concepts of stem-and-leaf plots and box-and-whisker plots, which are typically taught in middle school mathematics. The example provided is clear and easy to follow, making it accessible for students learning these concepts for the first time.
Why Use It:
This worksheet helps students understand different ways to visually represent data sets. It teaches them how to organize data into stem-and-leaf plots and box-and-whisker plots, enabling them to analyze the distribution and central tendency of the data. It promotes data literacy and critical thinking skills by requiring students to interpret and draw conclusions from the plots.
How to Use It:
Use the worksheet as a guide to understand how to create stem-and-leaf plots and box-and-whisker plots. Study the example provided and pay attention to the explanations of how to read and interpret each type of plot. Use the example data set to practice creating your own plots. The worksheet can be used as a reference when working with other data sets or as a review tool.
Target Users:
The target users are students in middle school (grades 6-8) who are learning about data representation and statistical analysis. It is also useful for teachers who are looking for a clear and concise example to illustrate stem-and-leaf plots and box-and-whisker plots.