


1 / 2
0
Views
0
Downloads

0 Likes
Bar Graph Basics: Birthday Month Data & Graphing Practice
0 Views
0 Downloads
Paste this activity's link or code into your existing LMS (Google Classroom, Canvas, Teams, Schoology, Moodle, etc.).
Students can open and work on the activity right away, with no student login required.
You'll still be able to track student progress and results from your teacher account.
Information
Description
What It Is:
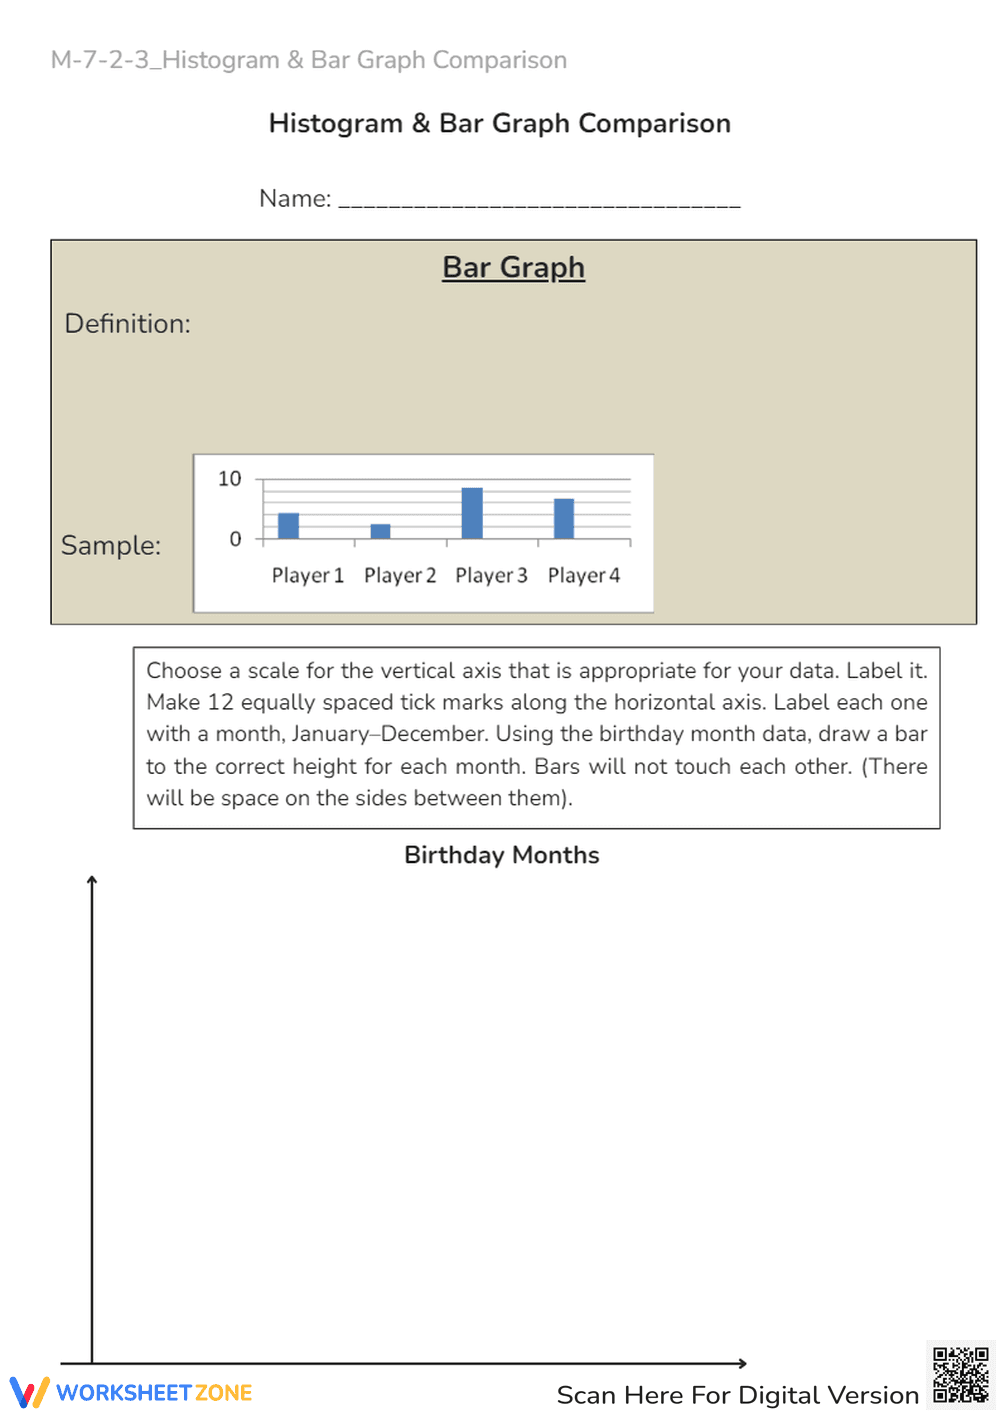
This is an educational worksheet focusing on bar graphs. It includes a section for defining a bar graph and a sample bar graph depicting data for 'Player 1' through 'Player 4'. The main activity is to create a bar graph representing birthday months, requiring students to label the x-axis with months from January to December and choose an appropriate scale for the y-axis to represent the data.
Grade Level Suitability:
This worksheet is suitable for grades 4-7. It requires understanding of basic data representation, graphing concepts, and labeling axes, which are typically taught in these grade levels. The activity involving birthday months allows for a real-world application of bar graph creation.
Why Use It:
This worksheet helps students learn about bar graphs, how to define them, and how to create them. It improves data interpretation skills, reinforces the concept of scaling graphs, and provides practice in labeling axes correctly. The birthday months activity makes learning relevant and engaging.
How to Use It:
First, have students define what a bar graph is. Then, review the sample bar graph. Finally, instruct students to create their own bar graph for birthday months, ensuring they choose an appropriate scale for the y-axis, label both axes correctly, and draw bars that represent the data for each month.
Target Users:
This worksheet is ideal for elementary and middle school students learning about data representation and graphing. It is also useful for teachers looking for engaging activities to reinforce bar graph concepts. Homeschooling parents can also use this worksheet to teach data handling skills.