


0
Views
0
Downloads

0.0
0
0 Likes
Graphing Linear Functions: Worksheet for Grades 7-9
0 Views
0 Downloads
Paste this activity's link or code into your existing LMS (Google Classroom, Canvas, Teams, Schoology, Moodle, etc.).
Students can open and work on the activity right away, with no student login required.
You'll still be able to track student progress and results from your teacher account.
Information
Description
What It Is:
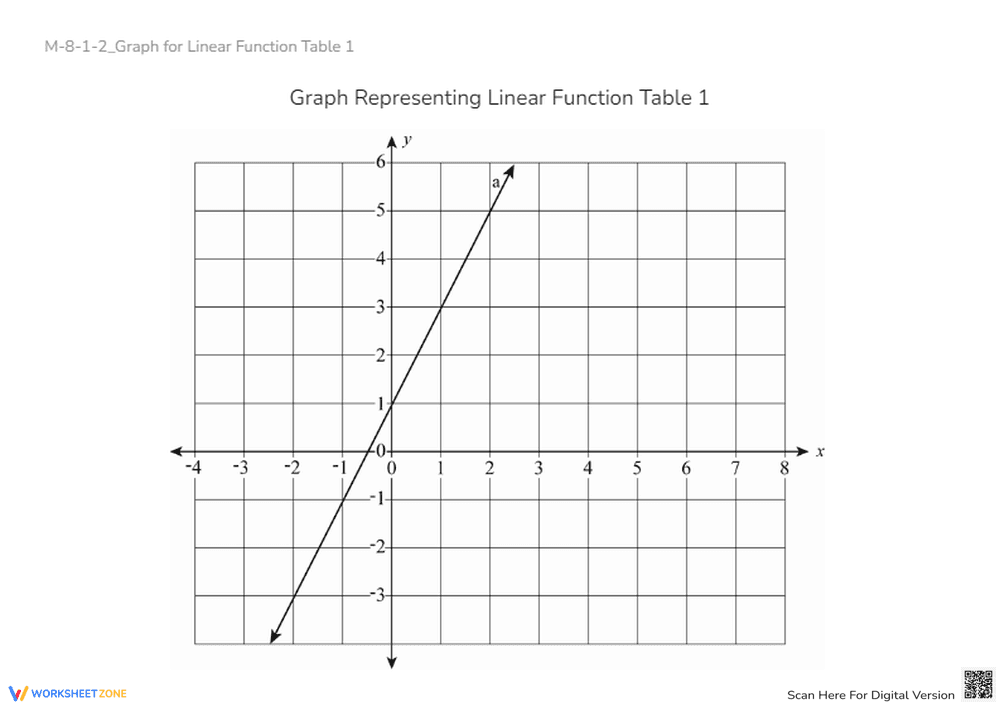
This is a worksheet featuring a graph representing a linear function. The graph is plotted on a coordinate plane with labeled x and y axes. A straight line is drawn on the graph, representing the linear function. The worksheet is titled 'Graph Representing Linear Function Table 1.'
Grade Level Suitability:
This worksheet is suitable for grades 7-9, specifically for students learning about linear functions and graphing. It helps students visualize linear relationships and understand how to represent them graphically.
Why Use It:
This worksheet helps students practice graphing linear functions. It reinforces the understanding of coordinate planes, x and y axes, and the visual representation of linear equations. It can be used to assess understanding or as a practice activity.
How to Use It:
The worksheet likely accompanies a table of values (not shown in the image). Students can use the provided graph to plot points from a given table of values or to determine the equation of the line already drawn. The student can also find the slope and y-intercept from the graph.
Target Users:
This worksheet is intended for middle school students, particularly those studying algebra and linear functions. It can be used by teachers as a classroom activity or homework assignment, and by students for self-study and practice.