


1 / 5
0
Views
0
Downloads


0.0
0
0 Likes
Graphing Absolute Value Functions: y = -1/2 |x| - Exit Ticket
0 Views
0 Downloads
Paste this activity's link or code into your existing LMS (Google Classroom, Canvas, Teams, Schoology, Moodle, etc.).
Students can open and work on the activity right away, with no student login required.
You'll still be able to track student progress and results from your teacher account.
Information
Description
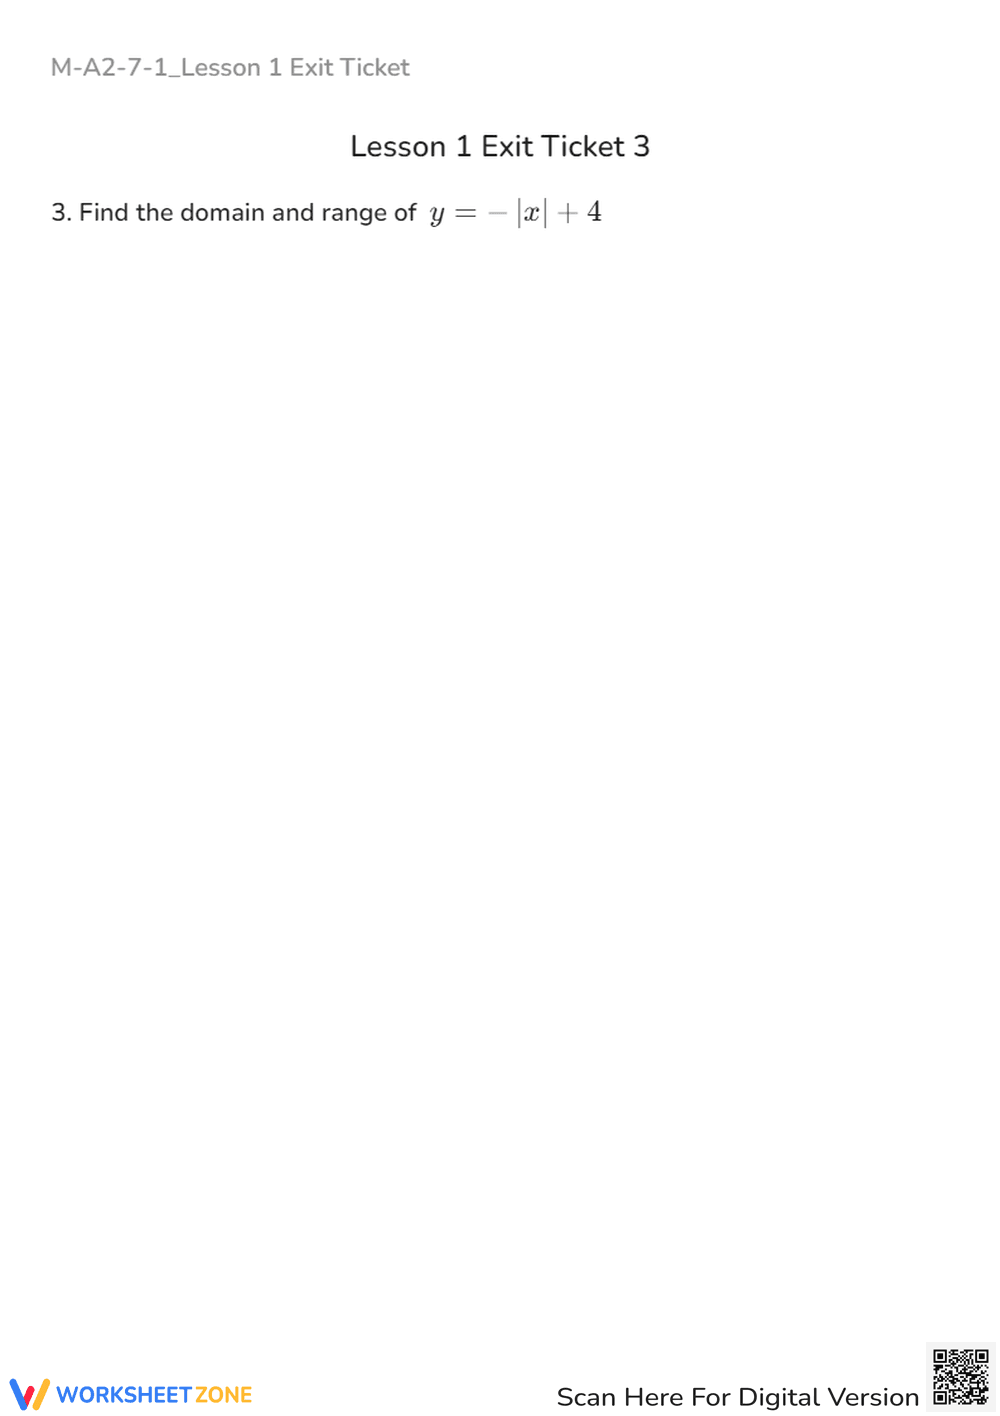
What It Is:
This is a single-question exit ticket worksheet focused on graphing absolute value functions. The specific problem asks students to graph the function y = -1/2 |x|. This is labeled as 'Lesson 1 Exit Ticket 1'.
Grade Level Suitability:
This worksheet is suitable for high school students, specifically grades 9-12, taking Algebra 2 or Precalculus. It requires understanding of absolute value functions and graphing techniques typically taught at these levels.
Why Use It:
This exit ticket helps assess student understanding of graphing absolute value functions and how coefficients affect the graph's shape and direction. It allows teachers to quickly gauge comprehension after a lesson on this topic.
How to Use It:
Provide students with the worksheet at the end of a lesson on graphing absolute value functions. Instruct them to graph the function y = -1/2 |x| on a coordinate plane (not provided on the worksheet image). Collect the completed worksheets to assess understanding.
Target Users:
The target users are high school students in Algebra 2 or Precalculus courses who are learning about graphing absolute value functions. It's also useful for teachers who need a quick assessment tool for this topic.