


1 / 2
0
Views
0
Downloads


0.0
0
0 Likes
Create and Interpret a Data Plot
0 Views
0 Downloads
Paste this activity's link or code into your existing LMS (Google Classroom, Canvas, Teams, Schoology, Moodle, etc.).
Students can open and work on the activity right away, with no student login required.
You'll still be able to track student progress and results from your teacher account.
Information
Description
What It Is:
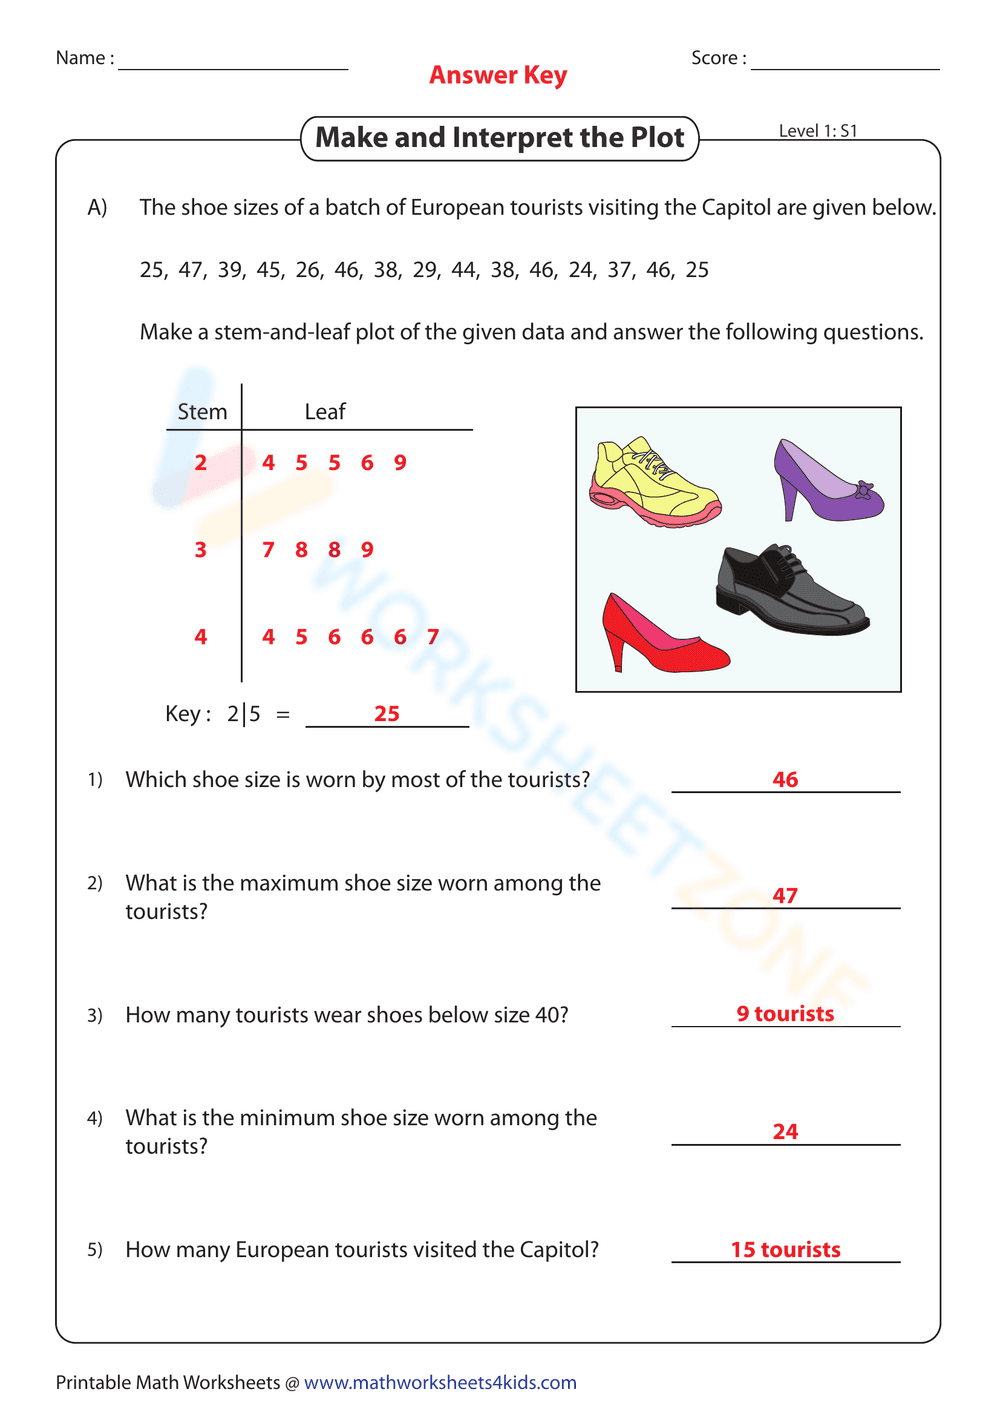
This is a math worksheet focused on creating and interpreting stem-and-leaf plots. The worksheet provides a set of shoe sizes from a group of European tourists visiting the Capitol. Students are instructed to create a stem-and-leaf plot from this data. Following the plot creation, students must answer five questions based on the data presented in the stem-and-leaf plot, such as finding the most frequent shoe size, the maximum and minimum shoe sizes, and the number of tourists with shoe sizes below 40. A key is provided to help interpret the stem-and-leaf plot.
Grade Level Suitability:
This worksheet is suitable for grades 4-6. It requires students to understand and apply the concept of stem-and-leaf plots, which is typically introduced in these grades. The questions require basic data analysis skills, making it appropriate for students developing their statistical reasoning.
Why Use It:
This worksheet helps students develop data organization and interpretation skills. Creating a stem-and-leaf plot allows students to visually organize data, making it easier to identify patterns and trends. Answering the questions reinforces their ability to extract information from the plot and apply it to solve real-world problems. It also provides practice in understanding statistical concepts like maximum, minimum, and frequency.
How to Use It:
First, students should read the shoe size data provided. Then, they should create a stem-and-leaf plot using the provided template, ensuring they follow the key. Once the plot is complete, students should answer the five questions based on the data displayed in the plot. Encourage students to double-check their work and use the plot to justify their answers.
Target Users:
This worksheet is ideal for elementary and middle school students learning about data representation and analysis. It can be used by teachers as part of a lesson on stem-and-leaf plots, or by parents to provide extra practice at home. Students who struggle with organizing and interpreting data will also benefit from this worksheet.