


1 / 2
0
Views
0
Downloads


0.0
0
0 Likes
Mean Absolute Deviation 1
0 Views
0 Downloads
Paste this activity's link or code into your existing LMS (Google Classroom, Canvas, Teams, Schoology, Moodle, etc.).
Students can open and work on the activity right away, with no student login required.
You'll still be able to track student progress and results from your teacher account.
Information
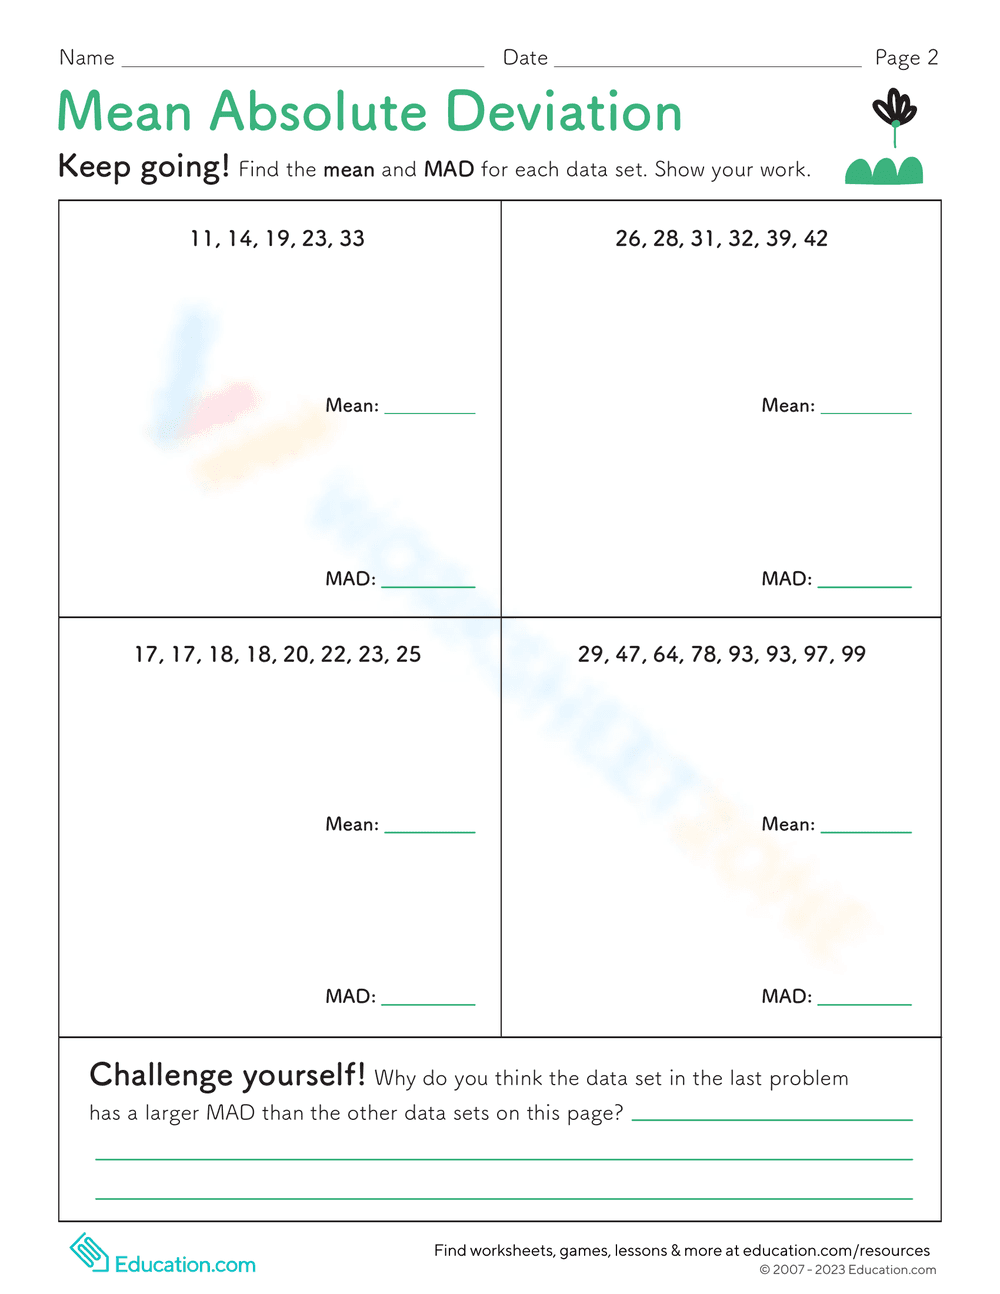
Description
The Mean Absolute Deviation, abbreviated as MAD, is a numerical indicator used to gauge the dispersion or the extent to which data values are scattered within a dataset. In this data and graphing worksheet designed for sixth-grade students, they will compute the mean absolute deviation for various datasets. This involves determining the mean of the dataset, calculating the distance between each data point and the mean, and subsequently computing the mean of these distances. Proficiency in calculating the mean absolute deviation equips students with a valuable skill for describing and contrasting different datasets effectively.