


1 / 2
0
Views
0
Downloads

0 Likes
Understanding Phase Diagrams
0 Views
0 Downloads
Paste this activity's link or code into your existing LMS (Google Classroom, Canvas, Teams, Schoology, Moodle, etc.).
Students can open and work on the activity right away, with no student login required.
You'll still be able to track student progress and results from your teacher account.
Information
Description
What It Is:
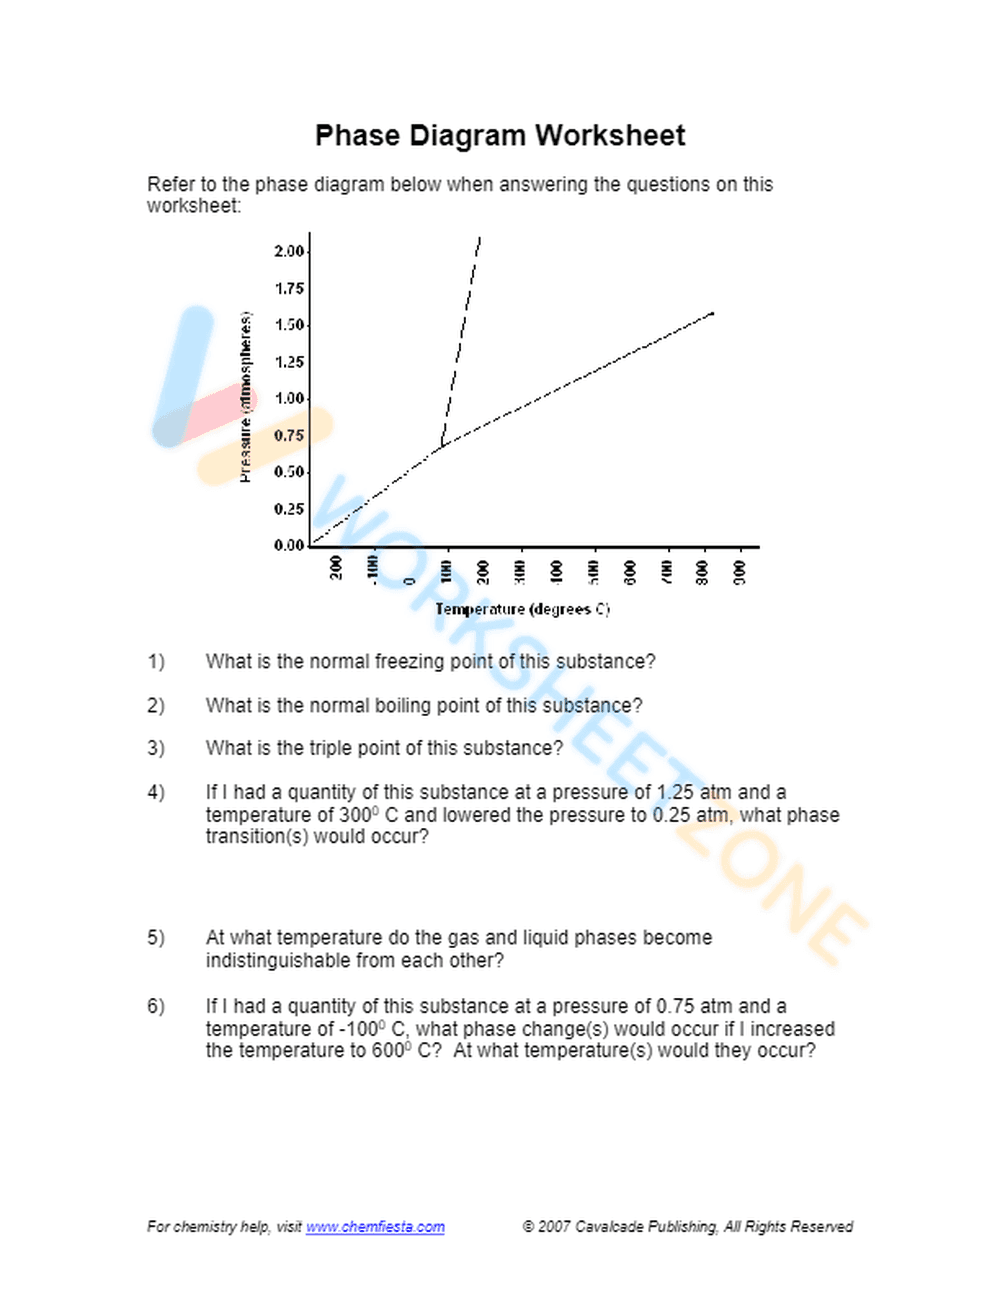
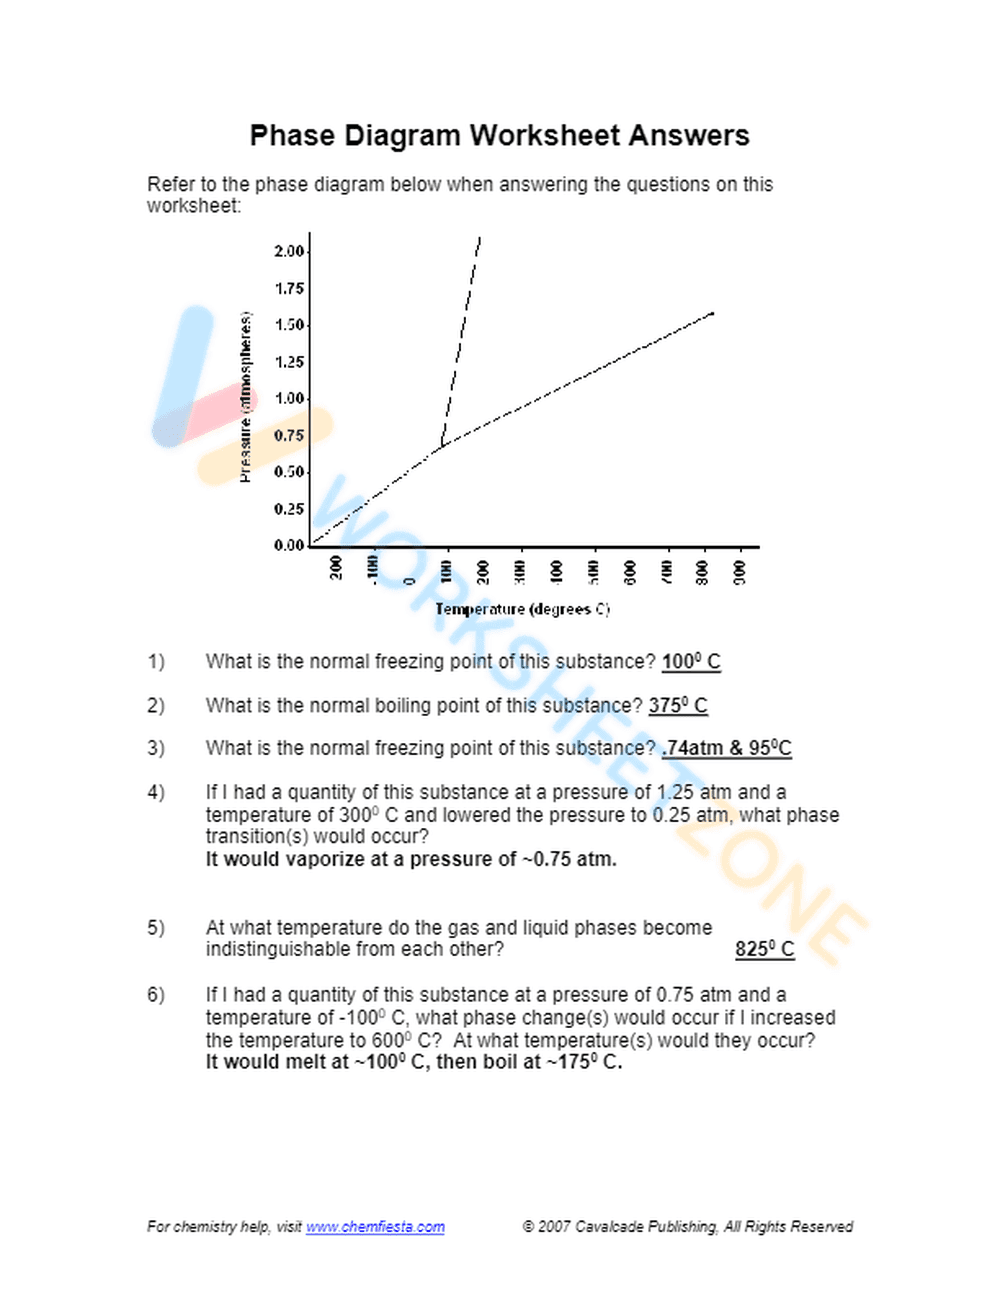
This is a chemistry worksheet focused on phase diagrams. It presents a pressure vs. temperature phase diagram and asks students to interpret it to answer questions about the normal freezing point, boiling point, and triple point of a substance. The worksheet also includes questions about phase transitions under changing pressure and temperature conditions.
Grade Level Suitability:
This worksheet is suitable for high school (Grades 11-12) or introductory college-level chemistry courses. The concepts of phase diagrams, phase transitions, and interpreting graphical data require a solid understanding of basic chemistry principles.
Why Use It:
This worksheet helps students develop skills in interpreting phase diagrams, understanding the relationship between pressure, temperature, and the phases of matter. It reinforces the concepts of freezing point, boiling point, and triple point, and challenges students to predict phase transitions based on changing conditions.
How to Use It:
Students should first carefully examine the provided phase diagram, paying attention to the axes and the lines separating the different phases. They should then use the diagram to answer the questions, using the pressure and temperature values to determine the state of the substance and predict phase transitions.
Target Users:
This worksheet is designed for high school and college students studying chemistry, particularly those learning about states of matter, phase transitions, and thermodynamics. It's also beneficial for teachers looking for practice problems to reinforce these concepts.