


1 / 2
0
Views
0
Downloads

0.0
0
0 Likes
Phase Diagram Worksheet: Chemistry
0 Views
0 Downloads
Paste this activity's link or code into your existing LMS (Google Classroom, Canvas, Teams, Schoology, Moodle, etc.).
Students can open and work on the activity right away, with no student login required.
You'll still be able to track student progress and results from your teacher account.
Information
Description
What It Is:
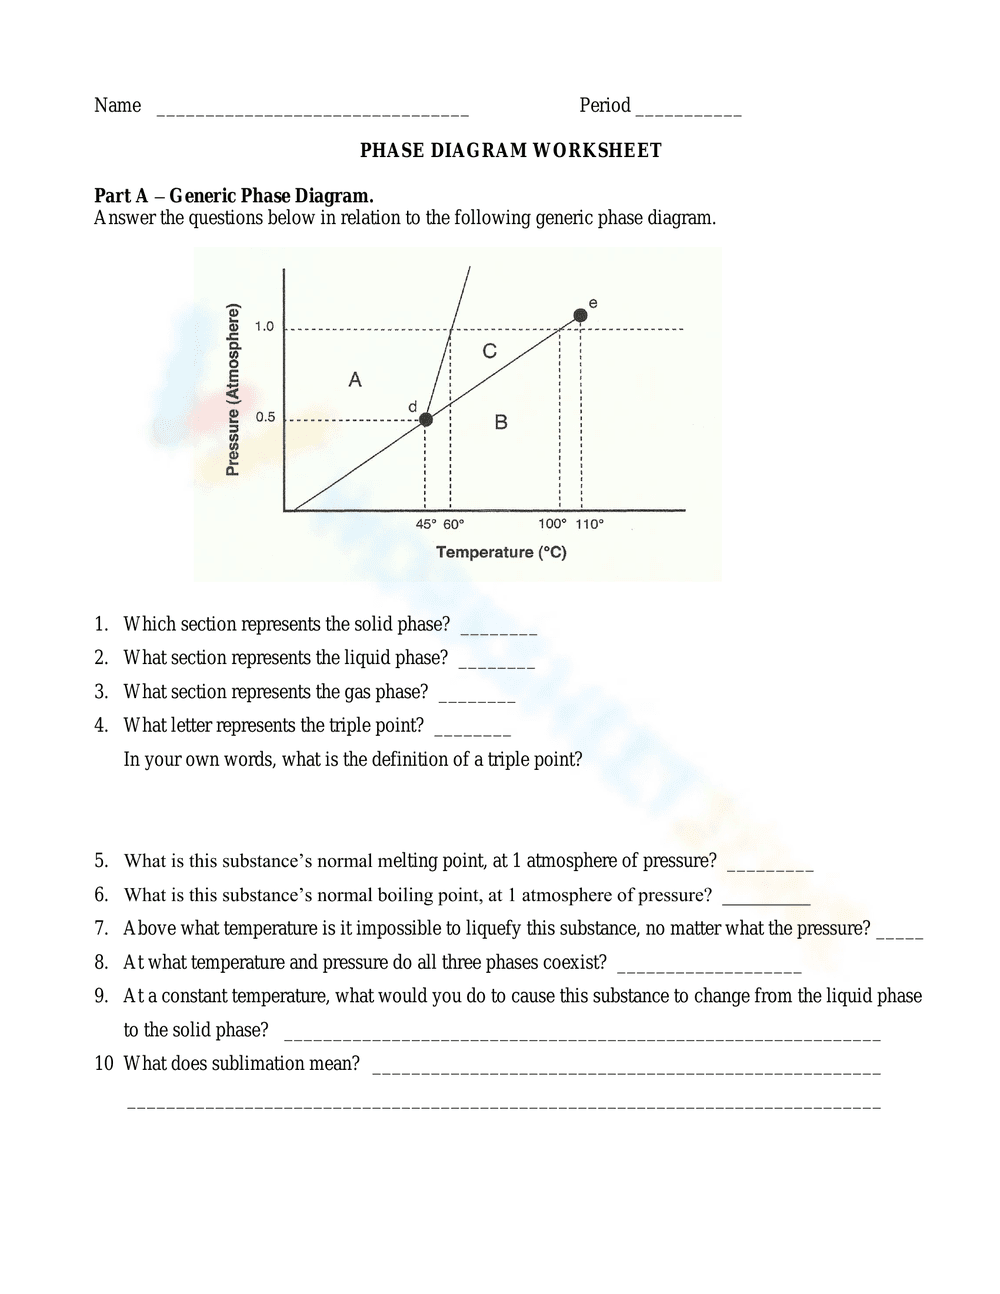
This is a science worksheet focusing on phase diagrams. It includes a generic phase diagram graph with axes labeled 'Pressure (Atmosphere)' and 'Temperature (°C)'. The diagram has three sections labeled A, B, and C, separated by lines, and a point labeled 'd'. The worksheet contains ten questions related to interpreting the phase diagram, including identifying the solid, liquid, and gas phases, the triple point, melting and boiling points, conditions for liquefaction, coexistence of phases, and the definition of sublimation.
Grade Level Suitability:
This worksheet is most suitable for high school students, specifically grades 9-12, or introductory college-level chemistry or physics courses. The concepts of phase diagrams, triple points, and phase transitions require a basic understanding of chemistry and thermodynamics typically taught at these levels.
Why Use It:
This worksheet helps students develop skills in interpreting phase diagrams, understanding the relationship between temperature, pressure, and the state of matter. It reinforces key concepts such as melting point, boiling point, triple point, and sublimation. It promotes critical thinking and problem-solving skills by requiring students to analyze the diagram and apply their knowledge to answer the questions.
How to Use It:
Students should first carefully examine the provided phase diagram, paying attention to the axes labels and the different regions representing the solid, liquid, and gas phases. They should then answer each question based on their interpretation of the diagram and their understanding of phase transitions. Some questions require numerical answers derived from the graph, while others require definitions or explanations in their own words.
Target Users:
The target users are high school or college students studying chemistry or physics. It is useful for students learning about phase transitions, phase diagrams, and the properties of matter. Teachers can use this as a practice activity, homework assignment, or assessment tool to gauge student understanding of these concepts.