


0
Views
0
Downloads

0.0
0
0 Likes
Read and Interpret Stem and Leaf Plots: Data Analysis
0 Views
0 Downloads
Paste this activity's link or code into your existing LMS (Google Classroom, Canvas, Teams, Schoology, Moodle, etc.).
Students can open and work on the activity right away, with no student login required.
You'll still be able to track student progress and results from your teacher account.
Information
Description
What It Is:
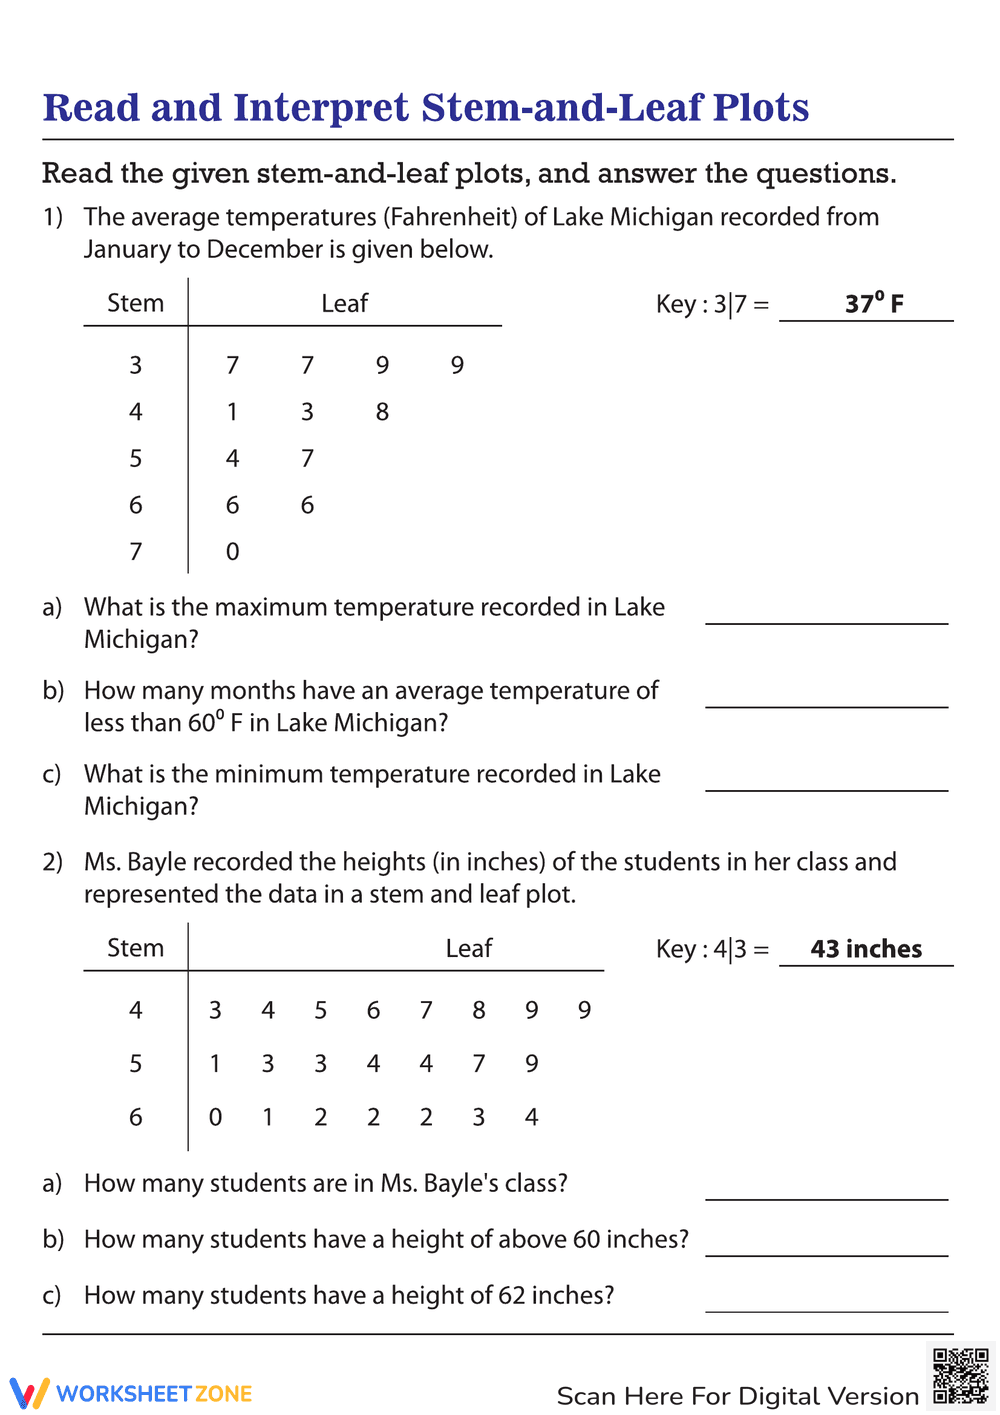
This is an educational worksheet focused on reading and interpreting stem-and-leaf plots. It presents two stem-and-leaf plots. The first plot shows average monthly temperatures of Lake Michigan. The second plot shows student heights in inches. Students are asked to answer questions based on the data presented in the plots, such as finding maximum and minimum values and counting data points within specific ranges.
Grade Level Suitability:
This worksheet is suitable for grades 5-7. It requires understanding of data representation, interpreting data sets, and answering questions based on that data. It reinforces skills in reading graphs and extracting relevant information.
Why Use It:
This worksheet helps students develop their data analysis and interpretation skills. It provides practice in reading stem-and-leaf plots and answering questions that require understanding of the data presented. It reinforces concepts of maximum, minimum, and frequency.
How to Use It:
Students should first read the stem-and-leaf plots carefully, paying attention to the key provided. Then, they should answer the questions by extracting the relevant information from the plots. Students should show their work or explain their reasoning where appropriate.
Target Users:
This worksheet is designed for students learning about data representation and analysis, specifically stem-and-leaf plots. It's beneficial for students in math classes focusing on statistics and data interpretation.