


1 / 3
0
Views
0
Downloads


0.0
0
0 Likes
Scatter Plot Exam: Correlation & Line of Best Fit
0 Views
0 Downloads
Paste this activity's link or code into your existing LMS (Google Classroom, Canvas, Teams, Schoology, Moodle, etc.).
Students can open and work on the activity right away, with no student login required.
You'll still be able to track student progress and results from your teacher account.
Information
Description
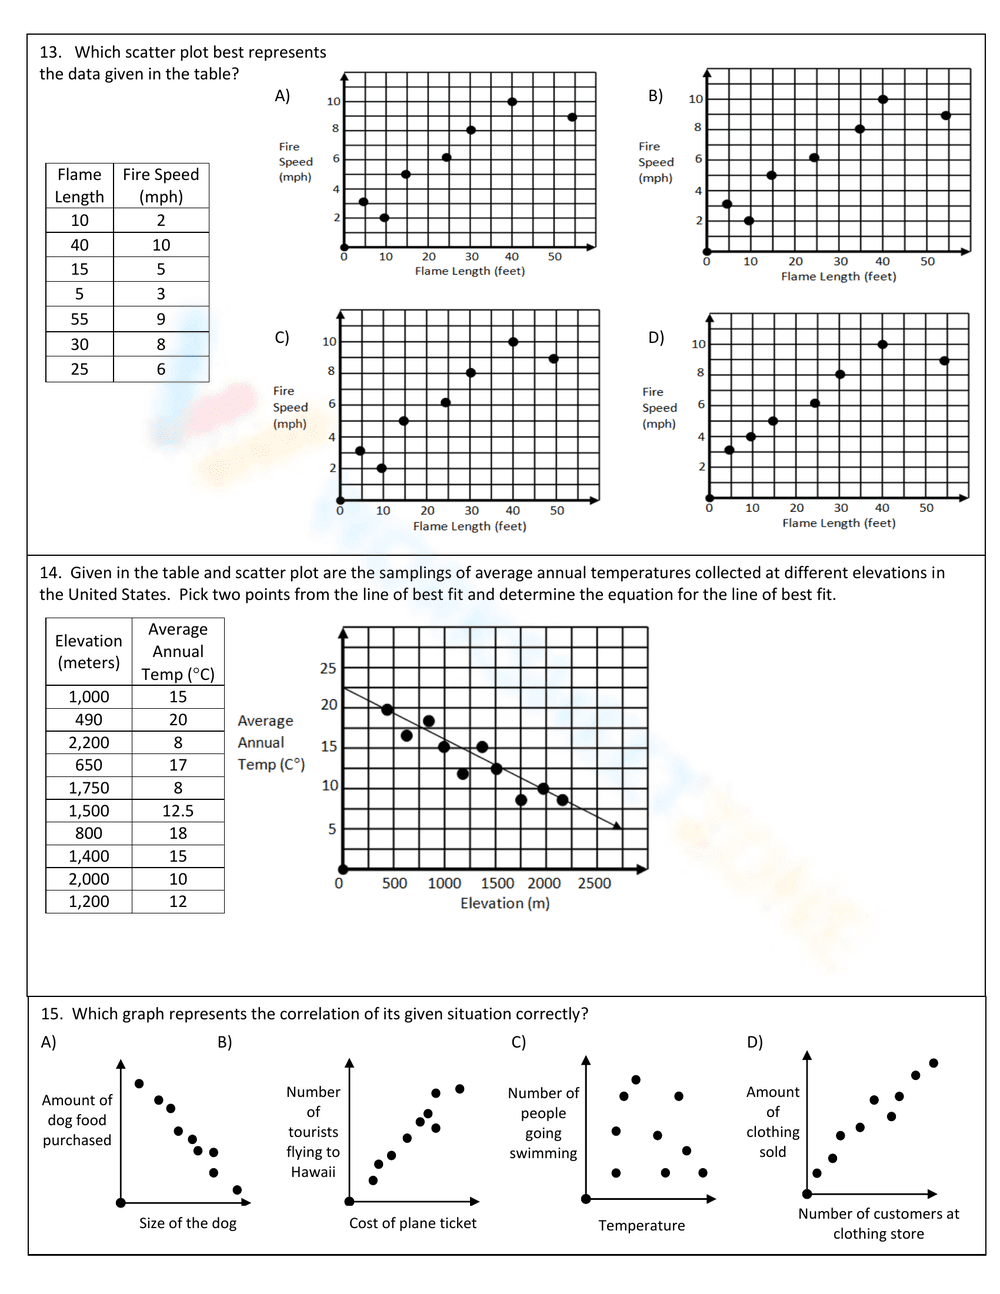
What It Is:
This is a high school math worksheet focusing on scatter plots, correlation, and line of best fit. It includes problems where students need to interpret linear models, create scatter plots from data tables, identify correlations (positive, negative, or no correlation), calculate the line of best fit using given points, and apply a linear equation to make predictions. The worksheet includes graphs with labeled axes and scatter plots with plotted points.
Grade Level Suitability:
The worksheet is suitable for high school students, specifically grades 9-12. The concepts of scatter plots, correlation, linear equations, and line of best fit are typically introduced and explored in high school algebra and statistics courses.
Why Use It:
This worksheet helps students develop skills in data analysis, graphical representation, and statistical modeling. It reinforces the understanding of linear relationships, correlation, and the application of linear equations to real-world scenarios. It helps them learn how to interpret and create scatter plots, identify correlations, and determine the line of best fit.
How to Use It:
Students can use this worksheet to practice creating scatter plots from data, identifying the type of correlation between variables, determining the equation of the line of best fit, and using the line of best fit to make predictions. They will need to plot points on a graph, analyze existing scatter plots, and apply linear equations to solve problems.
Target Users:
The target users are high school students learning about scatter plots, correlation, and line of best fit in algebra or statistics courses. It is also suitable for teachers looking for practice problems to reinforce these concepts.