


1 / 4
0
Views
0
Downloads

0 Likes
Updated Practice with Scatter Plots
0 Views
0 Downloads
Paste this activity's link or code into your existing LMS (Google Classroom, Canvas, Teams, Schoology, Moodle, etc.).
Students can open and work on the activity right away, with no student login required.
You'll still be able to track student progress and results from your teacher account.
Information
Description
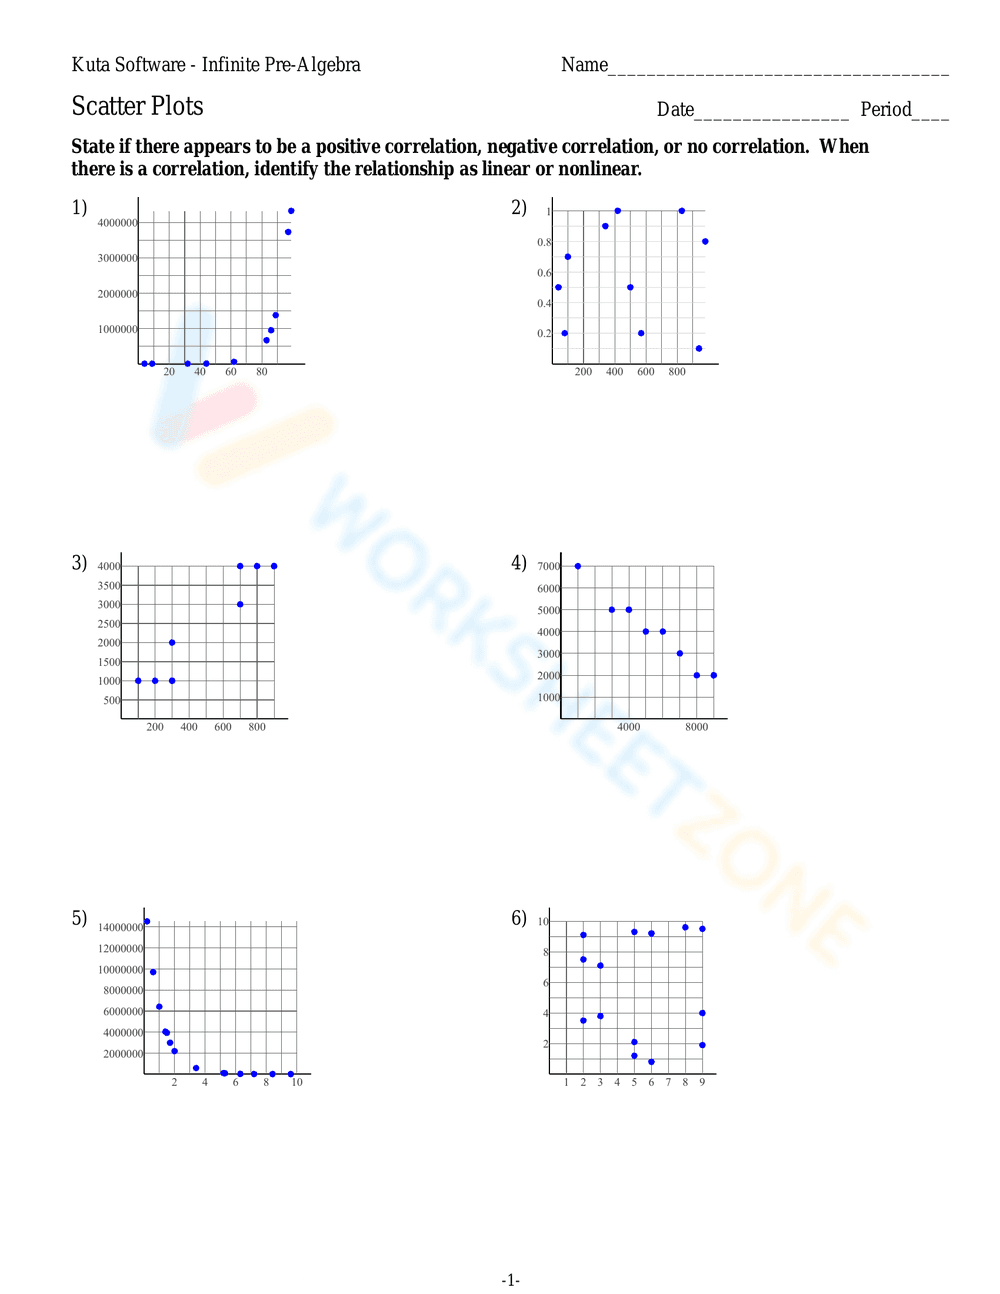
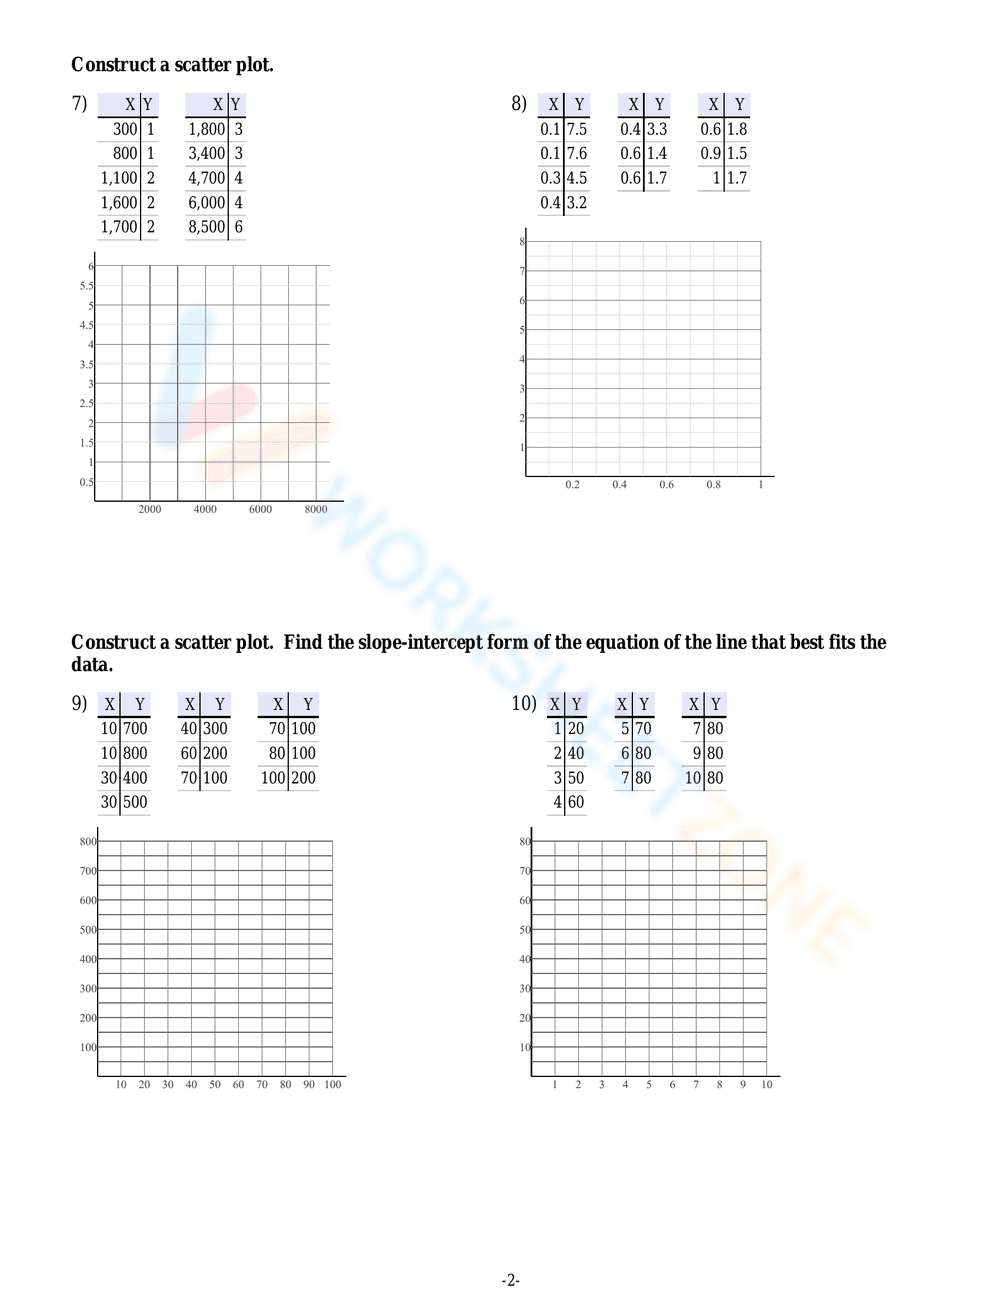
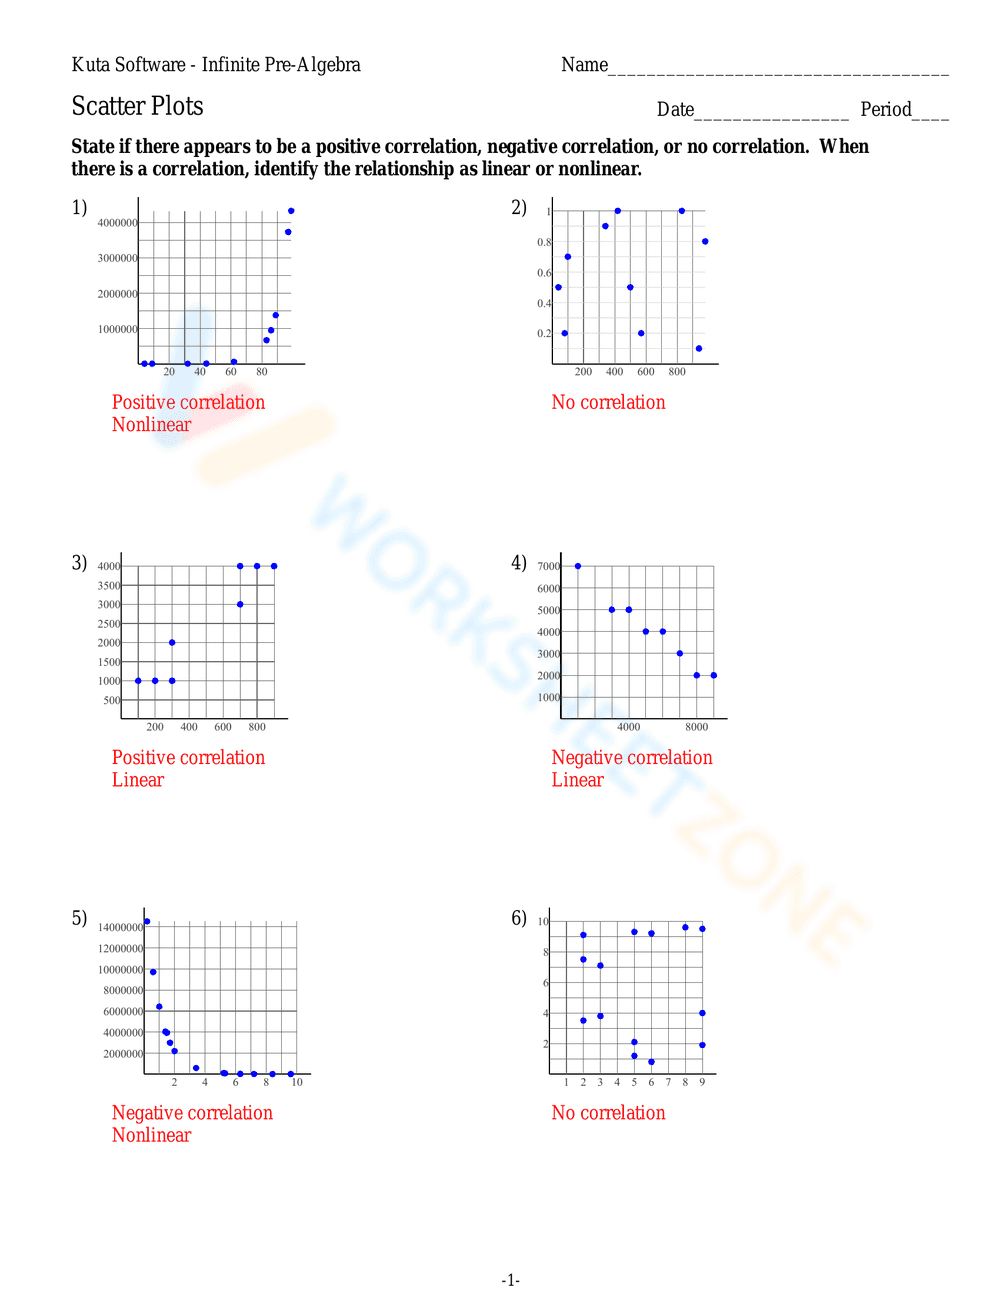
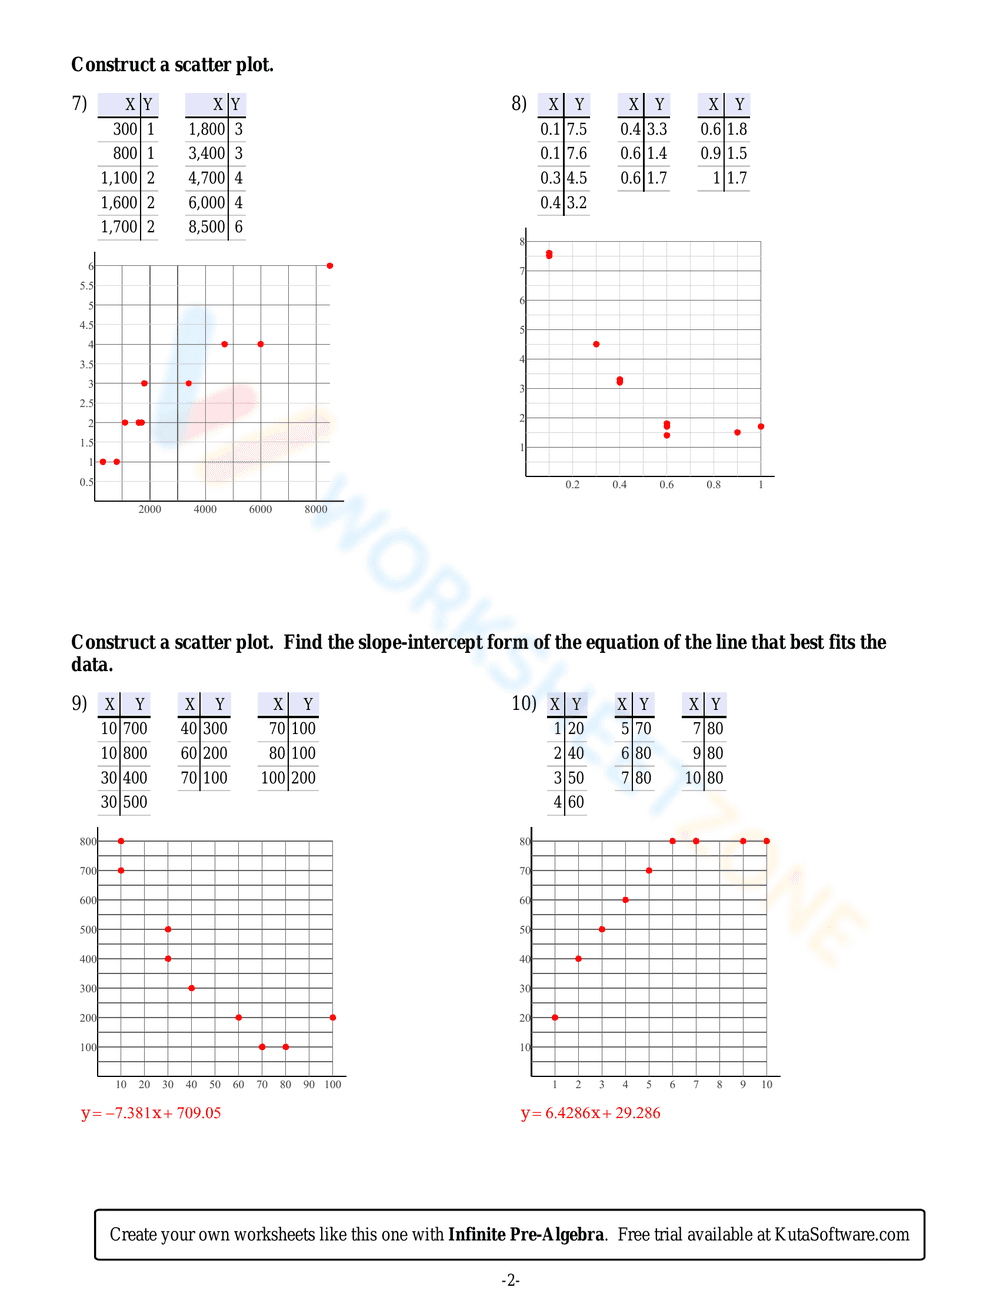
What It Is:
This is a math worksheet focusing on scatter plots. Students are asked to analyze various scatter plots and determine if there is a positive correlation, negative correlation, or no correlation. If a correlation exists, they must further identify whether the relationship is linear or nonlinear. The worksheet includes six different scatter plots with varying distributions of data points.
Grade Level Suitability:
This worksheet is suitable for grades 7-9, particularly in pre-algebra or algebra courses. It introduces or reinforces the concepts of correlation and linearity within the context of data analysis, which are typically covered in middle school and early high school mathematics.
Why Use It:
This worksheet helps students develop critical thinking and data interpretation skills. It allows them to visually analyze data presented in scatter plots and make judgments about the relationships between variables. It reinforces the understanding of correlation (positive, negative, or none) and linearity (linear or nonlinear), essential concepts in statistics and data analysis.
How to Use It:
Students should examine each scatter plot individually. They need to observe the general trend of the data points. If the points generally increase from left to right, it suggests a positive correlation. If they generally decrease, it suggests a negative correlation. If there is no discernible trend, it suggests no correlation. If a correlation is present, students should then determine if the relationship appears to be linear (points cluster around a straight line) or nonlinear (points follow a curve).
Target Users:
The target users are middle school and early high school students learning about scatter plots, correlation, and linear relationships. It is also useful for students who need extra practice in data interpretation and analysis. Teachers can use it as a classroom activity, homework assignment, or assessment tool.