


1 / 4
0
Views
0
Downloads


0.0
0
0 Likes
Solubility Curve Worksheet for Chemistry Students
0 Views
0 Downloads
Paste this activity's link or code into your existing LMS (Google Classroom, Canvas, Teams, Schoology, Moodle, etc.).
Students can open and work on the activity right away, with no student login required.
You'll still be able to track student progress and results from your teacher account.
Information
Description
What It Is:
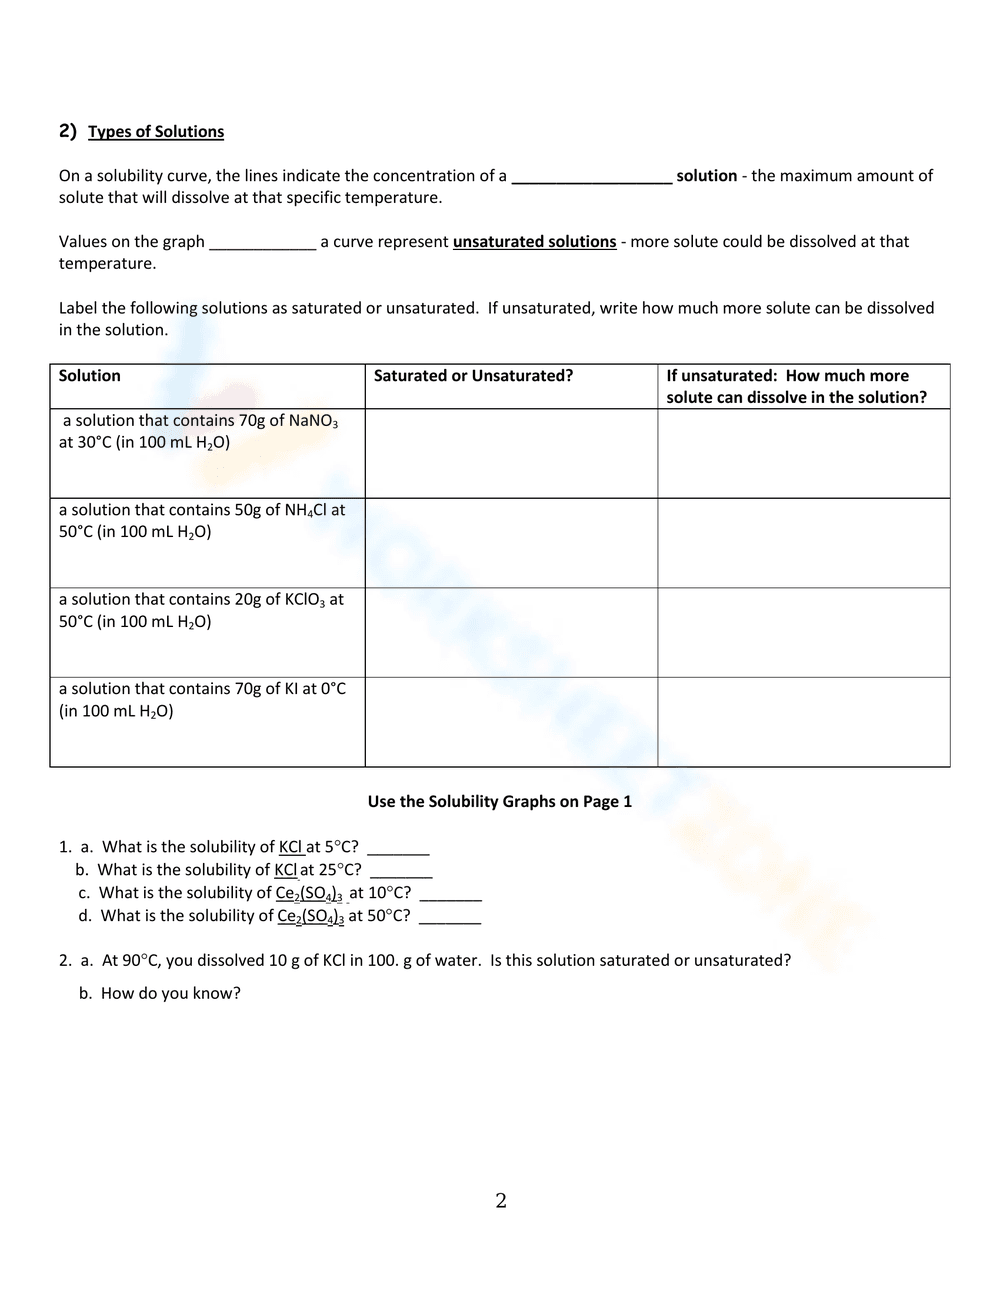
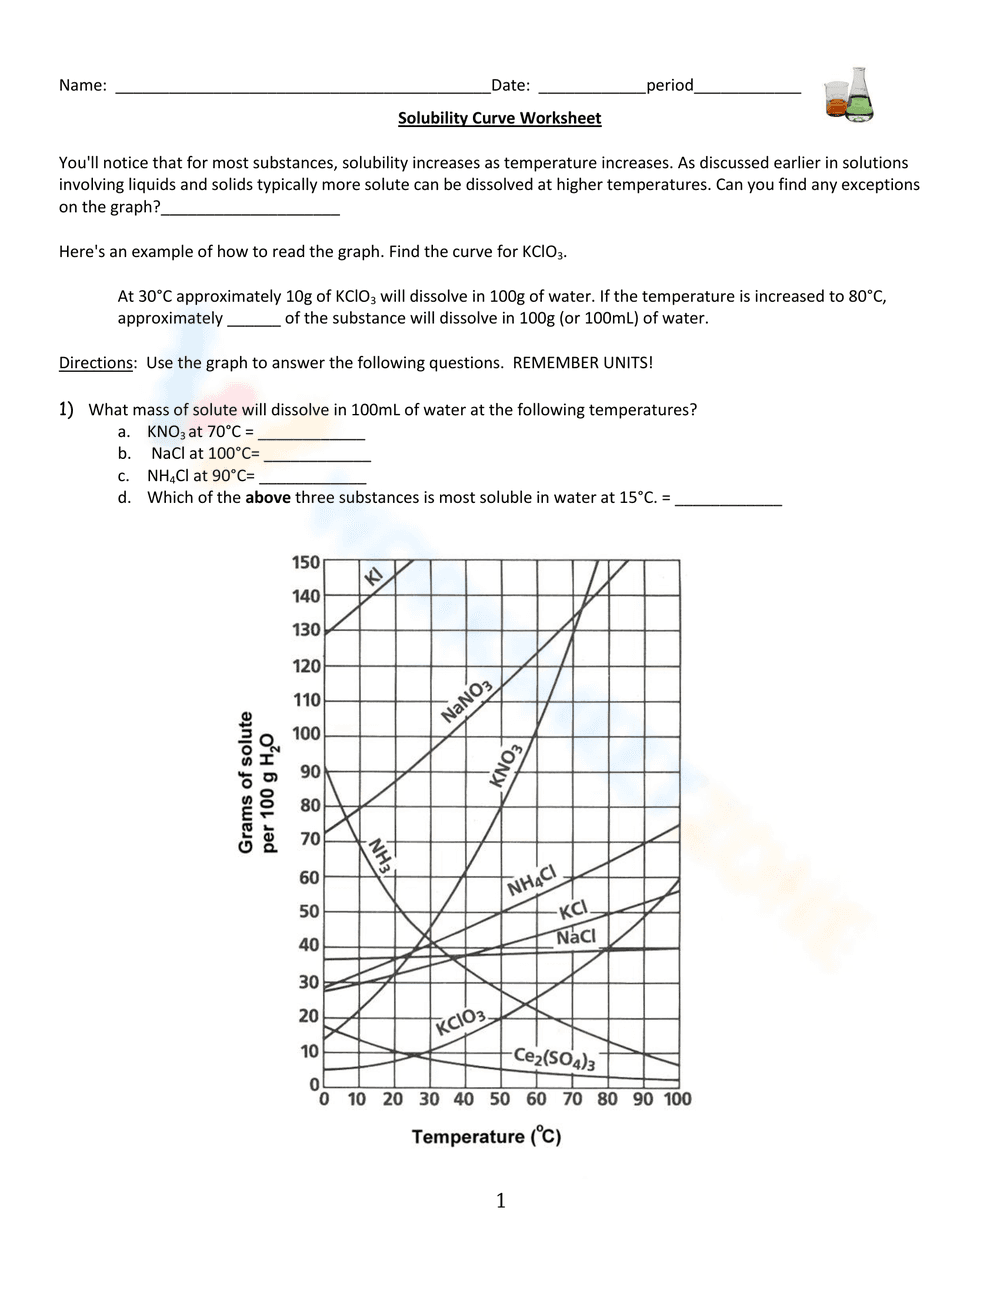
This is a chemistry worksheet focusing on solubility curves. It includes an introduction explaining the relationship between temperature and solubility, an example of how to read a solubility curve using KIO3, and questions requiring students to use a solubility graph to determine the mass of solute that will dissolve in 100ml of water at various temperatures for KNO3, NaCl, and NH4Cl. It also asks which of the three substances is most soluble at 15°C. The graph plots grams of solute per 100g H2O against temperature in Celsius, showing solubility curves for multiple compounds like KI, NaNO3, KNO3, NH4Cl, KCl, NaCl, KIO3, and Ce2(SO4)3.
Grade Level Suitability:
This worksheet is suitable for grades 9-12, particularly for high school chemistry students. It requires understanding of graphs, interpreting data, and applying scientific concepts related to solubility and solutions.
Why Use It:
This worksheet helps students develop skills in reading and interpreting solubility curves, understanding the relationship between temperature and solubility, and applying this knowledge to solve quantitative problems. It reinforces the concept of solubility and how it varies for different substances at different temperatures.
How to Use It:
Students should first read the introduction and example to understand the relationship between temperature and solubility and how to read the solubility curve. Then, using the provided graph, they should determine the solubility of each substance (KNO3, NaCl, NH4Cl) at the specified temperatures (70°C, 100°C, 90°C) and record the corresponding mass of solute that will dissolve in 100ml of water. Finally, they should identify which of the three substances is most soluble at 15°C based on the graph. Remember to include the correct units in your answer.
Target Users:
This worksheet is designed for high school chemistry students learning about solutions, solubility, and interpreting graphical data. It is appropriate for students who have been introduced to the concepts of solubility curves and the factors affecting solubility.