


1 / 2
0
Views
0
Downloads

0.0
0
0 Likes
Solubility Curve Worksheet
0 Views
0 Downloads
Information
Description
What It Is:
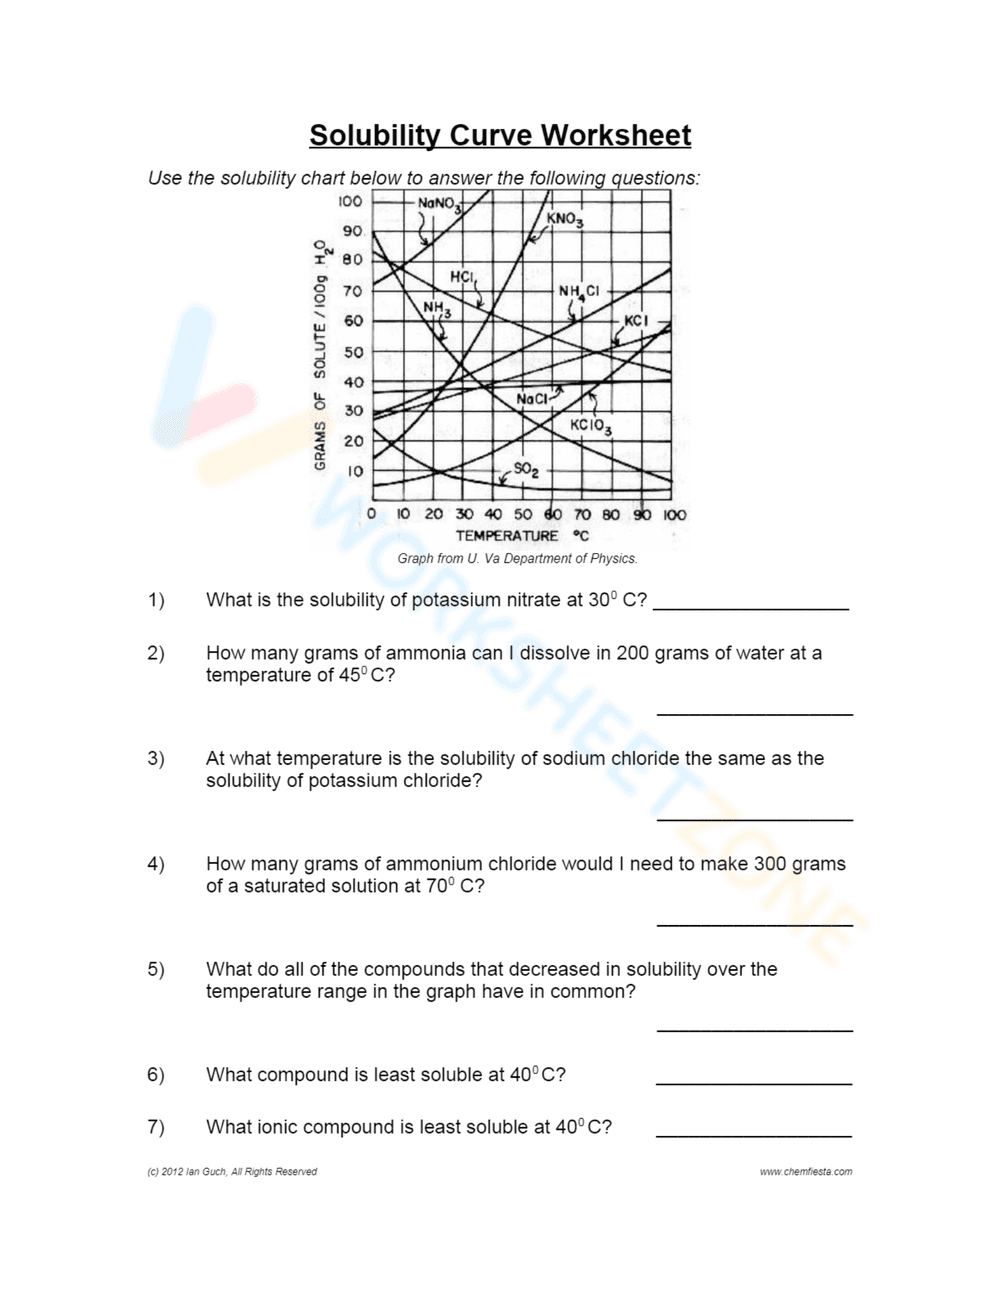
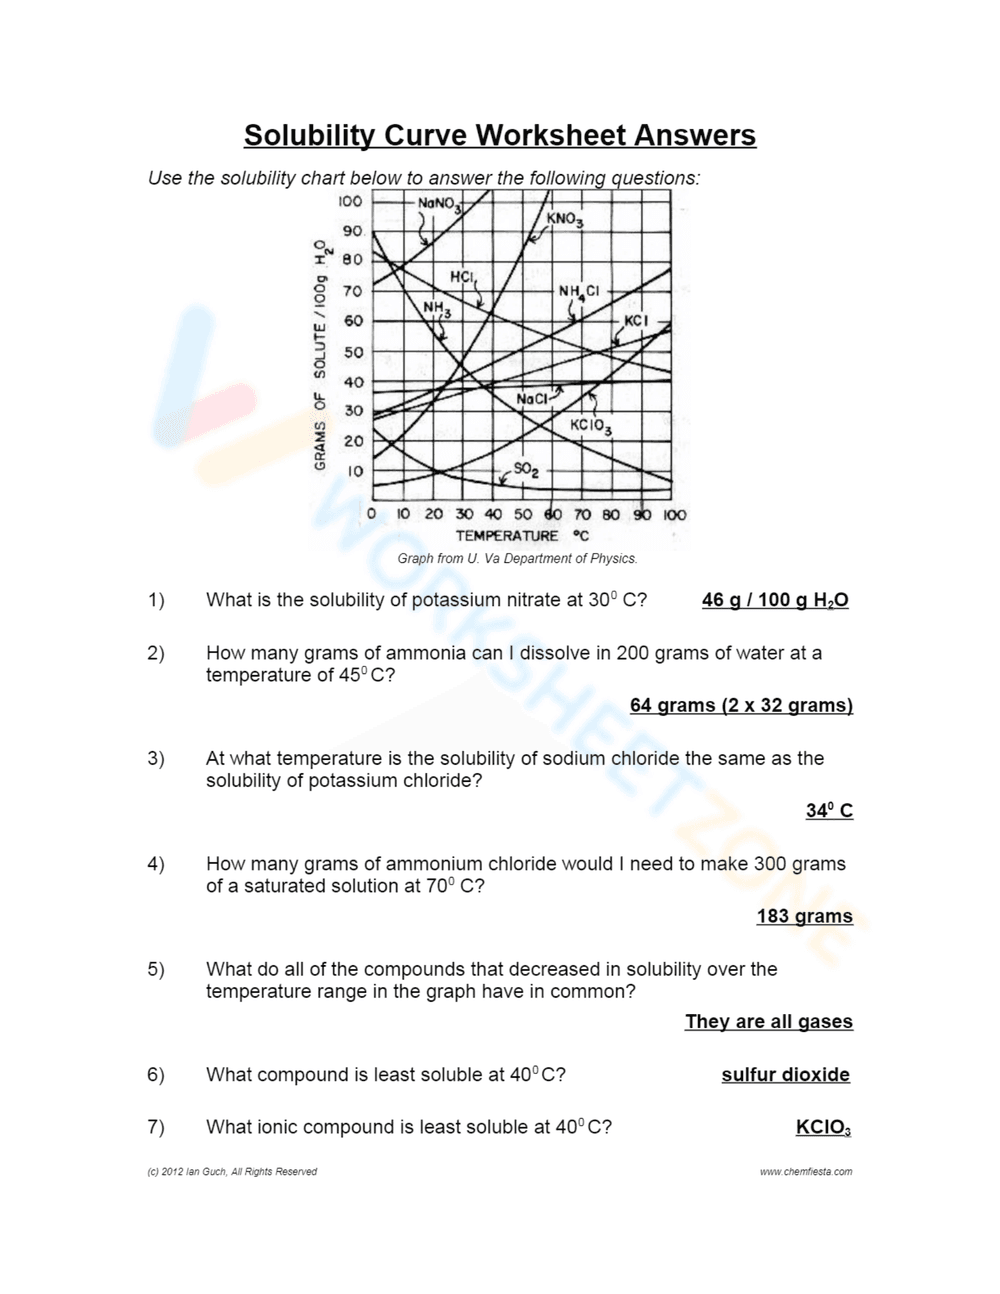
This is a solubility curve worksheet. It features a graph plotting the solubility of various compounds (like KNO3, NaCl, NH4Cl, and SO2) against temperature. The worksheet contains seven questions requiring students to interpret the graph to determine solubilities at specific temperatures, compare solubilities, and analyze trends in solubility.
Grade Level Suitability:
This worksheet is suitable for grades 9-12, particularly for chemistry or physical science courses. The content requires understanding of graphs, data interpretation, and basic chemistry concepts related to solubility and solutions.
Why Use It:
This worksheet helps students develop skills in reading and interpreting graphs, applying scientific data to solve problems, and understanding the relationship between temperature and solubility. It reinforces key concepts in chemistry related to solutions, saturation, and solubility curves.
How to Use It:
Students should use the provided solubility curve graph to answer the questions. They will need to identify the solubility of different compounds at specific temperatures, determine temperatures where solubilities are equal, and calculate amounts of solute needed for saturated solutions.
Target Users:
The target users are high school students in chemistry or physical science classes, as well as teachers looking for resources to teach or reinforce concepts related to solubility curves and solutions.