


1 / 2
0
Views
0
Downloads


0.0
0
0 Likes
Solubility Curves Key Worksheet
0 Views
0 Downloads
Paste this activity's link or code into your existing LMS (Google Classroom, Canvas, Teams, Schoology, Moodle, etc.).
Students can open and work on the activity right away, with no student login required.
You'll still be able to track student progress and results from your teacher account.
Information
Description
What It Is:
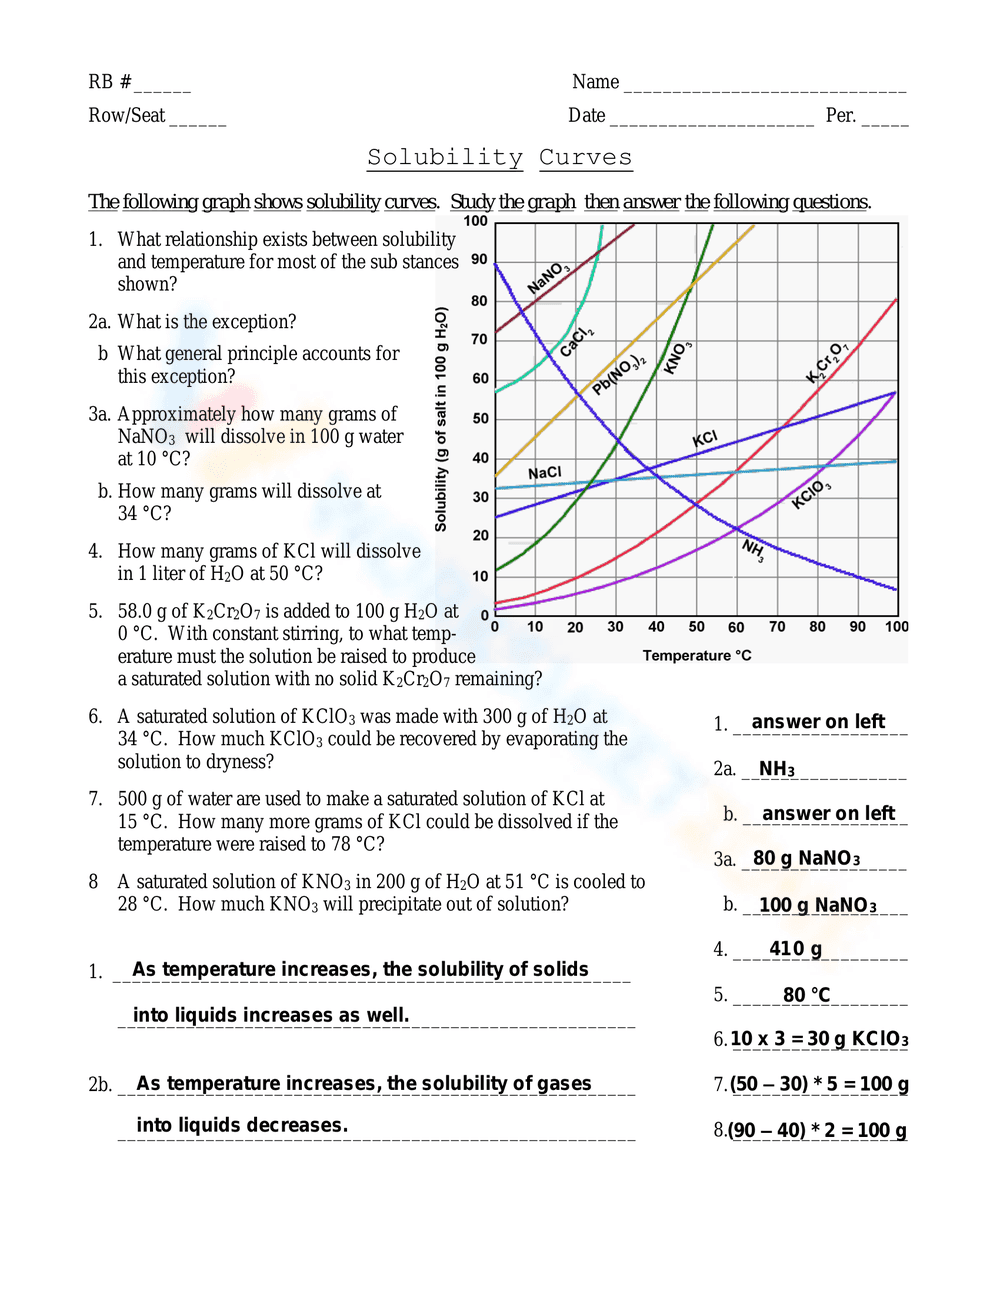
This is a chemistry worksheet focusing on solubility curves. It presents a graph displaying the solubility of various substances (like NaNO3, KCl, KNO3, KClO3, K2Cr2O7, NaCl) at different temperatures. Students are asked to analyze the graph and answer questions about the relationship between solubility and temperature, identify exceptions to the general trend, and calculate the amount of substance that will dissolve at specific temperatures, including precipitation calculations.
Grade Level Suitability:
This worksheet is suitable for high school chemistry, specifically grades 9-12. The concepts of solubility, saturation, and interpreting graphs are typically taught at this level. The calculations involving grams of solute and temperature changes require a solid understanding of chemistry principles.
Why Use It:
This worksheet reinforces the understanding of solubility curves and their practical applications. It allows students to practice reading and interpreting graphical data, apply their knowledge of solubility rules, and perform calculations related to solution concentration and precipitation. It enhances critical thinking and problem-solving skills in a chemistry context.
How to Use It:
Students should first carefully study the provided solubility curve graph. They need to analyze the axes and the trends shown by each substance. Then, they should answer the questions by referring to the graph to find the solubility at given temperatures, calculating the amount of solute dissolved or precipitated, and applying their understanding of chemical principles. Students write their answers in the spaces provided.
Target Users:
This worksheet is designed for high school chemistry students, particularly those studying solutions and solubility. It's useful for teachers looking for practice problems to reinforce the concepts taught in class and for students who need extra practice interpreting solubility curves.