


1 / 2
0
Views
0
Downloads

0.0
0
0 Likes
Create a Stem and Leaf Plot Worksheet
0 Views
0 Downloads
Paste this activity's link or code into your existing LMS (Google Classroom, Canvas, Teams, Schoology, Moodle, etc.).
Students can open and work on the activity right away, with no student login required.
You'll still be able to track student progress and results from your teacher account.
Information
Description
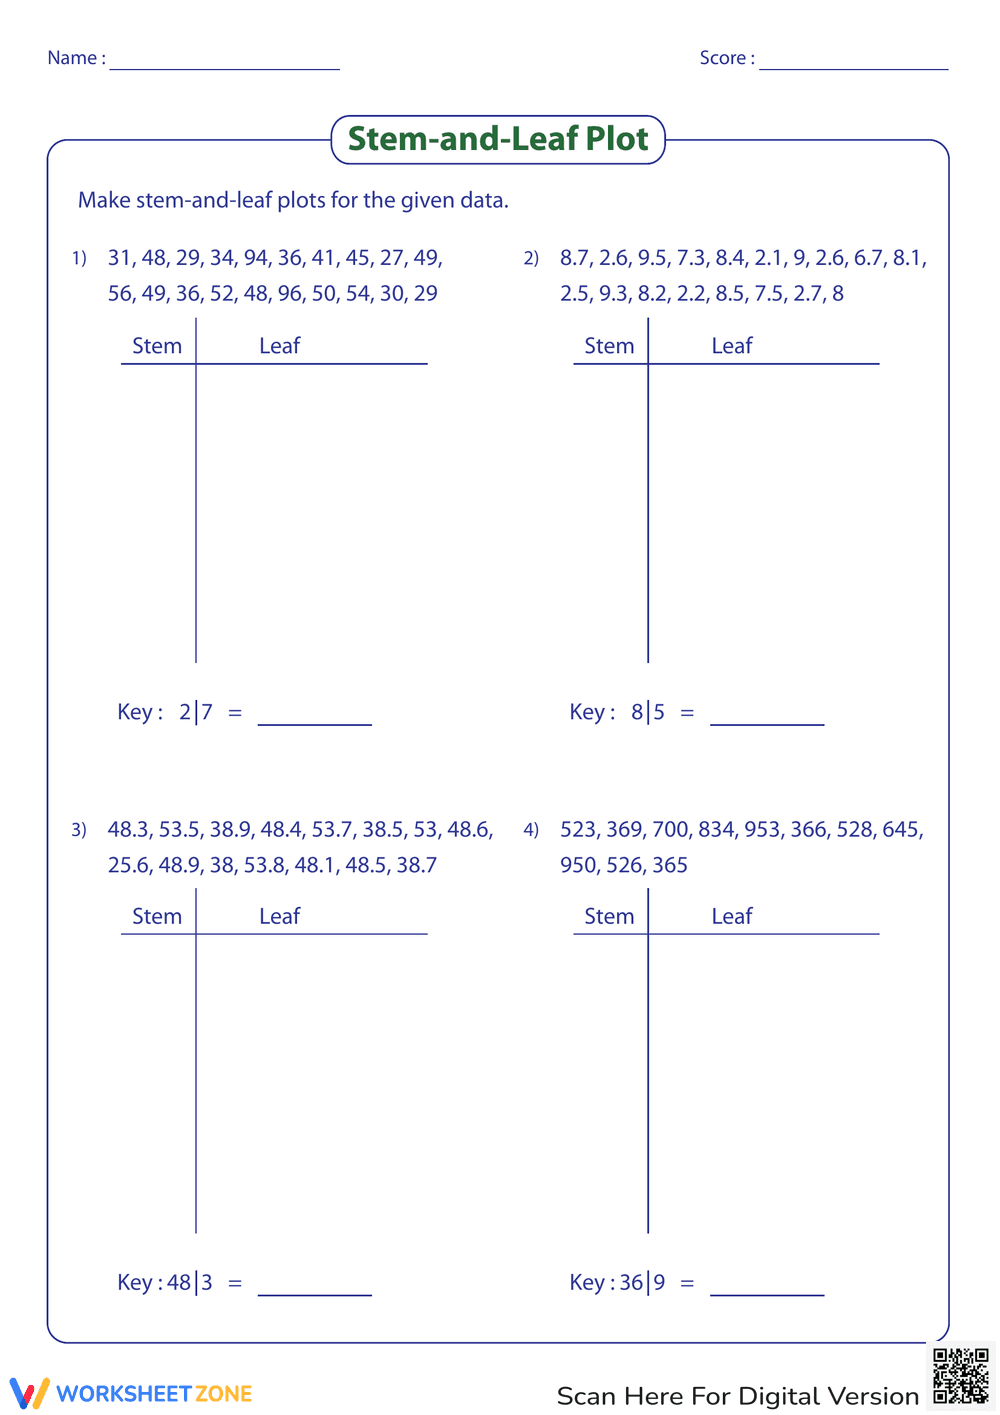
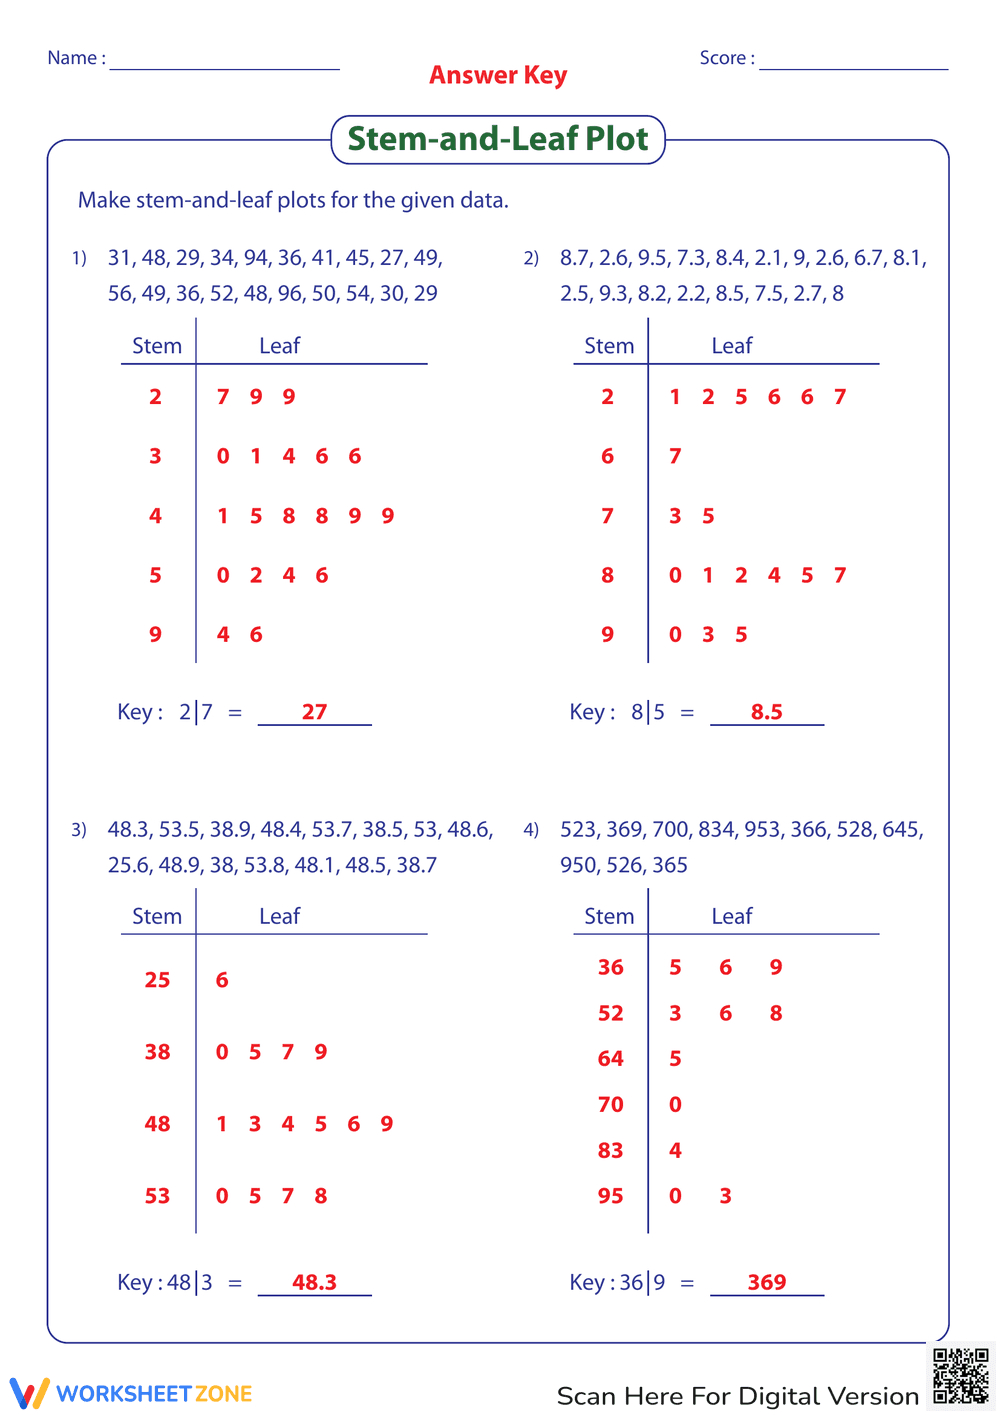
What It Is:
This is a math worksheet focused on creating stem-and-leaf plots. The worksheet presents four sets of numerical data. Students are instructed to organize each data set into a stem-and-leaf plot using provided stem and leaf table outlines. Each stem-and-leaf plot includes a key to help students interpret the data.
Grade Level Suitability:
This worksheet is suitable for grades 5-7. It requires an understanding of place value and data organization, which are typically taught in these grade levels. The inclusion of decimal numbers in some data sets increases the complexity, making it appropriate for older elementary or early middle school students. The last problem has three digit numbers which makes it more challenging.
Why Use It:
This worksheet helps students develop skills in data organization, interpretation, and representation. Creating stem-and-leaf plots reinforces understanding of place value. It also provides a visual way to analyze and compare data sets, improving analytical skills.
How to Use It:
First, read the given data set. Next, identify the stems (tens place, hundreds place, etc.) and leaves (ones place, tens place, etc.). Create the stem-and-leaf plot by listing the stems in a column and then writing the corresponding leaves next to each stem in ascending order. Finally, use the key to explain what the plot means.
Target Users:
This worksheet is designed for students who are learning about stem-and-leaf plots and data analysis. It is useful for teachers looking for practice activities or assessments on this topic. It's also helpful for students needing extra practice with data representation.