


1 / 2
0
Views
0
Downloads

0.0
0
0 Likes
Introduction to Stem and Leaf Plot Worksheet
0 Views
0 Downloads
Paste this activity's link or code into your existing LMS (Google Classroom, Canvas, Teams, Schoology, Moodle, etc.).
Students can open and work on the activity right away, with no student login required.
You'll still be able to track student progress and results from your teacher account.
Information
Description
What It Is:
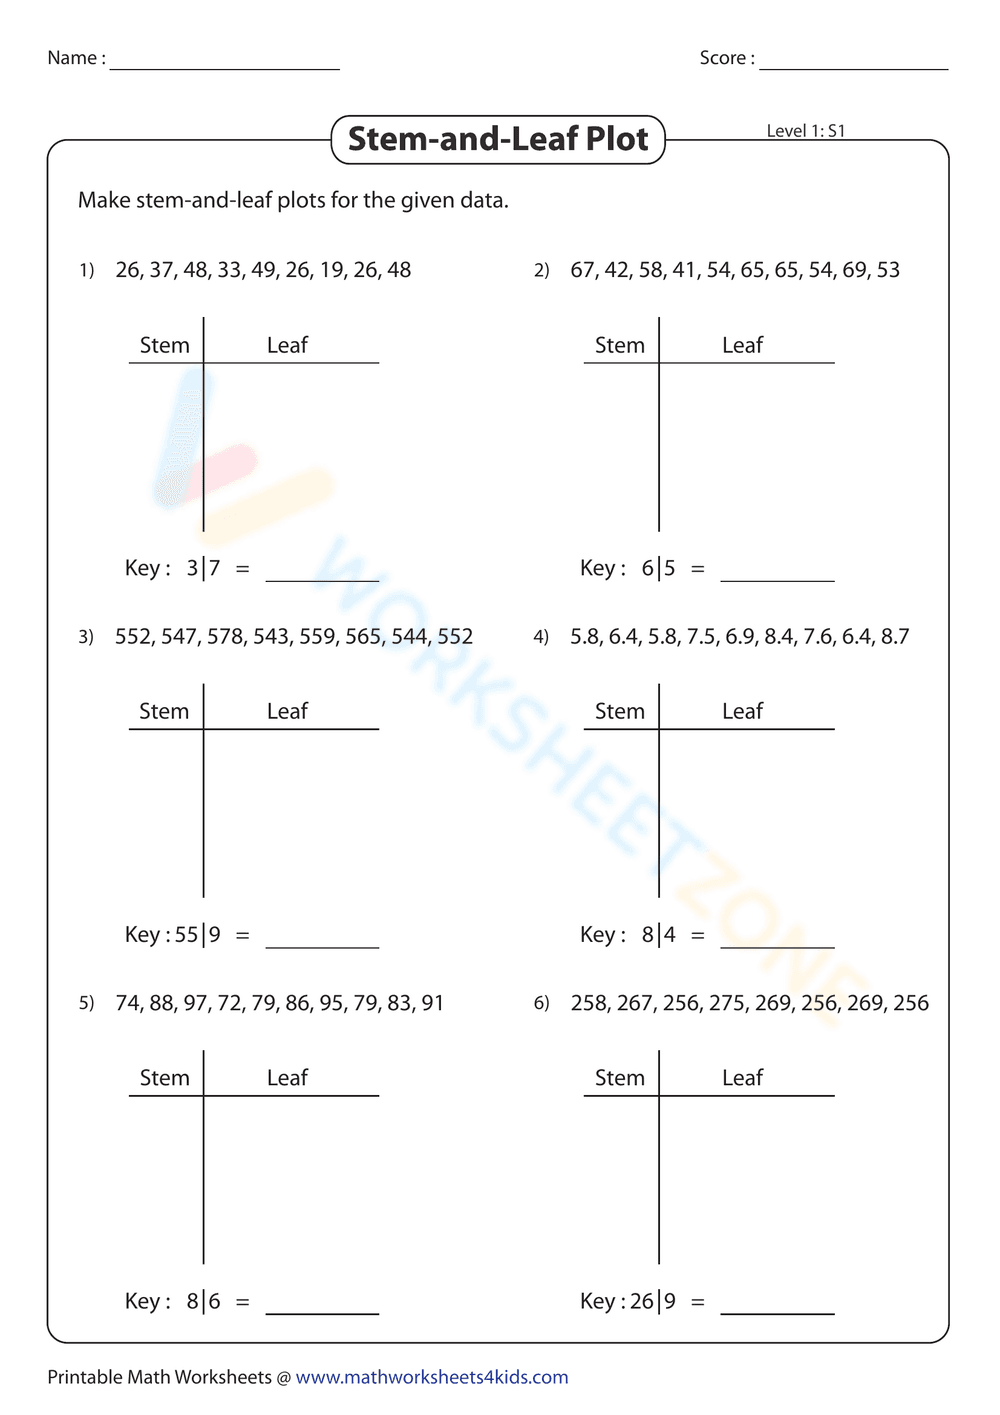
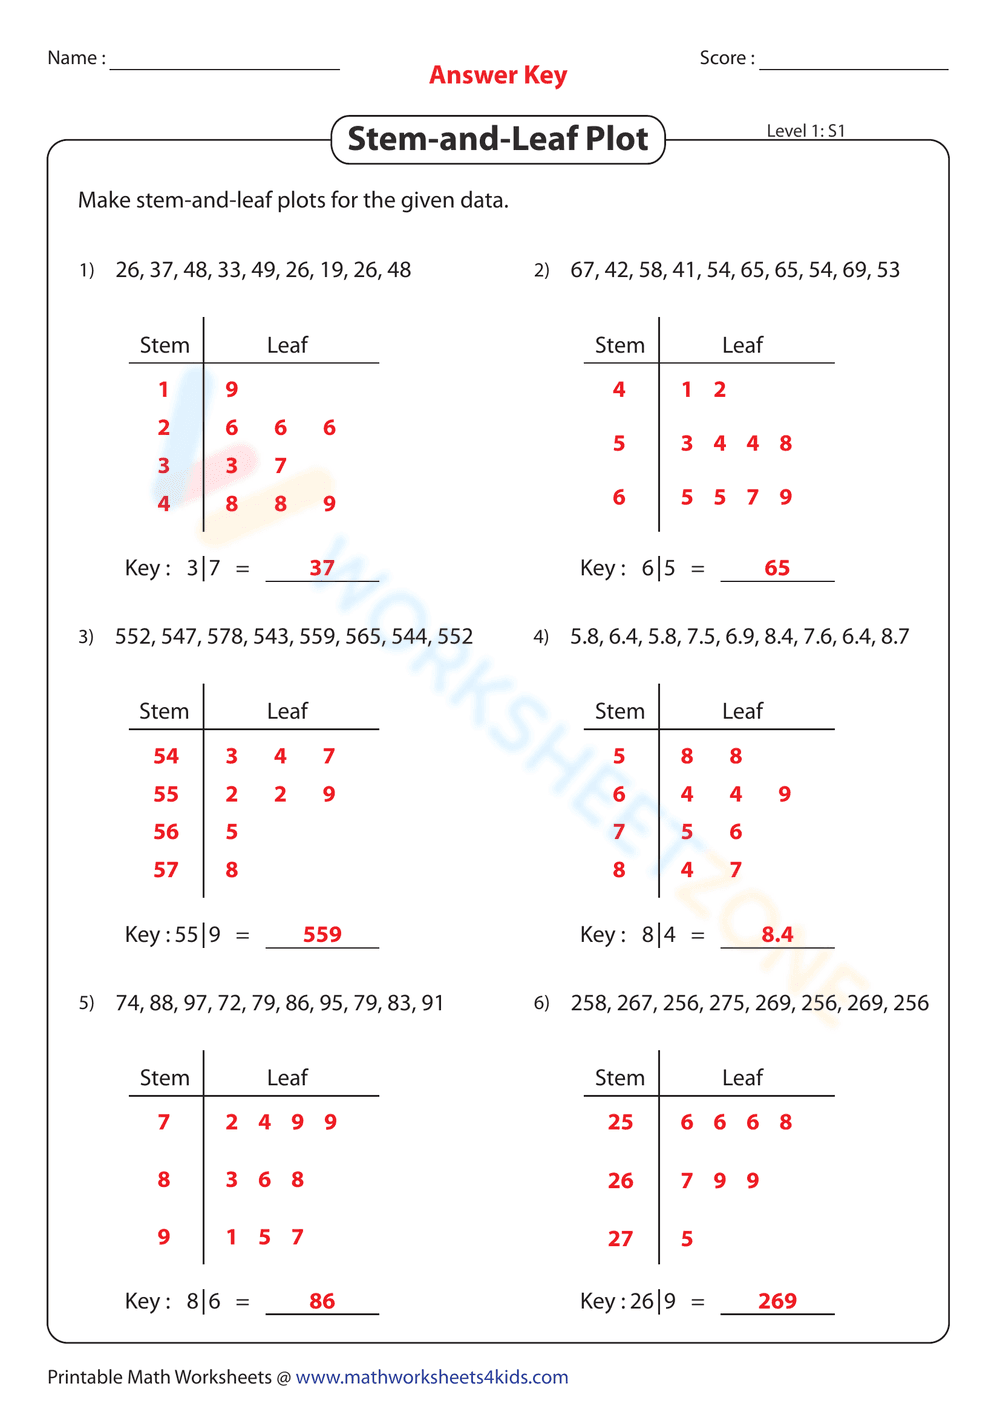
This is a math worksheet focused on creating stem-and-leaf plots. The worksheet presents six sets of numerical data and provides blank stem-and-leaf plot templates for students to organize the data. Each problem also includes a key example to help students understand how to interpret the plot (e.g., '3|7 =' or '6|5 ='). The data includes two-digit numbers, three-digit numbers, and decimals.
Grade Level Suitability:
This worksheet is suitable for grades 4-6. It requires students to understand place value, data organization, and basic statistical concepts. The use of decimals in one of the problems may make it more appropriate for upper elementary or early middle school.
Why Use It:
This worksheet helps students develop skills in organizing and interpreting data using stem-and-leaf plots. It reinforces understanding of place value and provides a visual representation of data distribution. Completing this worksheet will improve data analysis skills and statistical thinking.
How to Use It:
Students should examine each data set and identify the stems (tens, hundreds, or whole numbers) and leaves (ones or decimals). They should then fill in the stem-and-leaf plot, organizing the leaves in ascending order for each stem. Finally, they should use the provided key to correctly interpret and complete the example.
Target Users:
The target users are elementary and middle school students learning about data representation and statistical analysis. It is particularly useful for students who need practice with stem-and-leaf plots or those who benefit from visual learning aids in math.