


1 / 2
0
Views
0
Downloads

0 Likes
Stem and Leaf Plot: Data Representation Worksheet
0 Views
0 Downloads
Paste this activity's link or code into your existing LMS (Google Classroom, Canvas, Teams, Schoology, Moodle, etc.).
Students can open and work on the activity right away, with no student login required.
You'll still be able to track student progress and results from your teacher account.
Information
Description
What It Is:
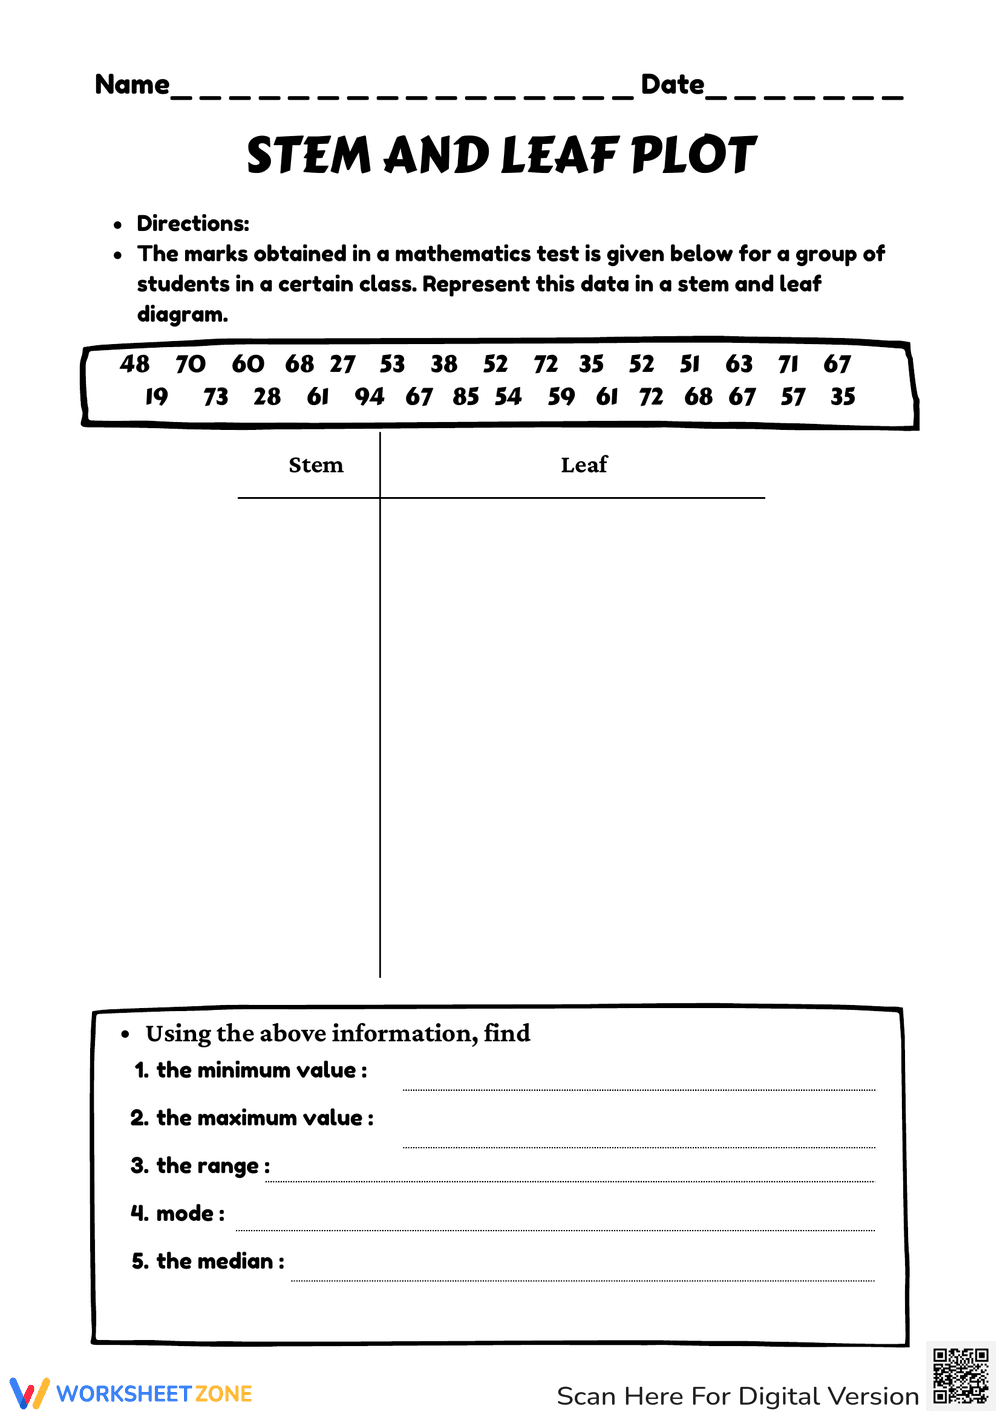
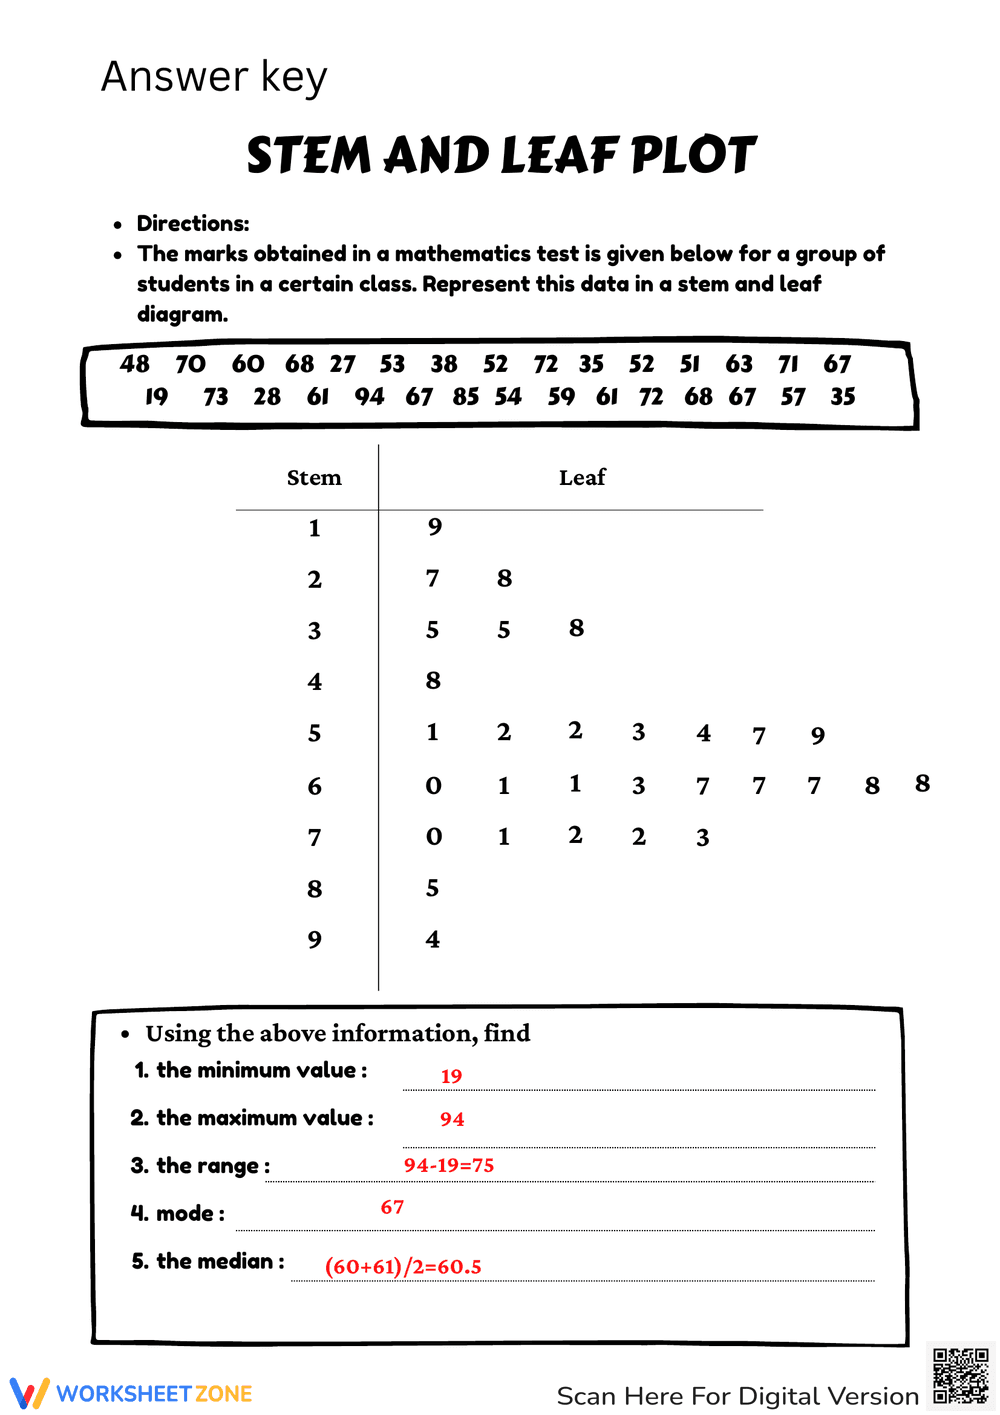
This is a math worksheet focused on creating and interpreting a stem and leaf plot. The worksheet provides a set of numerical data representing test scores and instructs the student to create a stem and leaf plot to organize the data. Following the plot creation, the student is asked to calculate the minimum value, maximum value, range, mode, and median from the data.
Grade Level Suitability:
This worksheet is suitable for grades 5-7. It requires understanding of data organization, place value, and basic statistical measures like minimum, maximum, range, mode, and median. These concepts are typically introduced and reinforced in these grade levels.
Why Use It:
This worksheet helps students develop data organization skills by using stem and leaf plots. It reinforces understanding of place value and helps students visually represent and analyze numerical data. It also allows students to practice calculating key statistical measures, improving their data interpretation abilities.
How to Use It:
First, have students read the instructions and data provided. Guide them in creating the stem and leaf plot using the provided table, ensuring they understand how to separate the data into stems (tens place) and leaves (ones place). Then, instruct them to use the organized data in the stem and leaf plot to find the minimum value, maximum value, range, mode, and median, writing their answers in the provided blanks.
Target Users:
This worksheet is ideal for students learning about data representation and basic statistics. It is suitable for classroom practice, homework assignments, or as a review activity for students who need extra support with stem and leaf plots and data analysis.