


0
Views
0
Downloads

0.0
0
0 Likes
Stem and Leaf Plot Worksheet: Data Analysis Practice
0 Views
0 Downloads
Paste this activity's link or code into your existing LMS (Google Classroom, Canvas, Teams, Schoology, Moodle, etc.).
Students can open and work on the activity right away, with no student login required.
You'll still be able to track student progress and results from your teacher account.
Information
Description
What It Is:
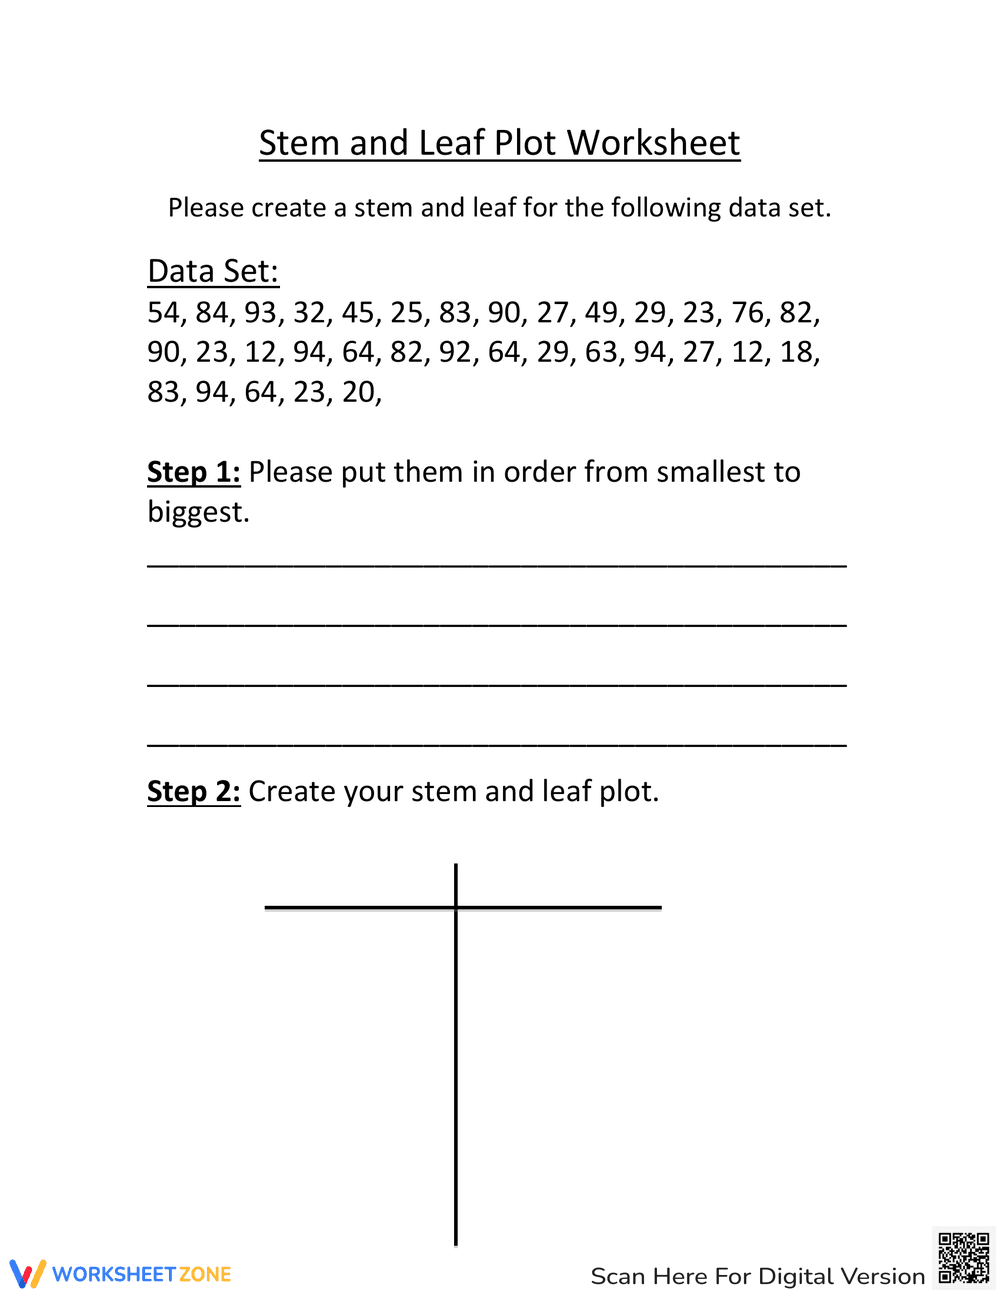
This is a math worksheet focusing on creating stem and leaf plots. It provides a data set of two-digit numbers (e.g., 54, 84, 93, etc.) and asks the student to first order the data from smallest to largest. Then, it provides a blank stem and leaf plot template for the student to organize the data.
Grade Level Suitability:
This worksheet is suitable for grades 5-7. It requires an understanding of place value and the ability to organize data, skills typically developed in these grade levels. The data set includes numbers up to the 90s, making it appropriate for this range.
Why Use It:
This worksheet helps students learn to organize and represent numerical data using stem and leaf plots. It reinforces skills in ordering numbers, understanding place value, and interpreting data, which are important for data analysis and statistical reasoning.
How to Use It:
First, have students rewrite the provided data set in ascending order on the lines provided. Then, using the ordered data, students should create a stem and leaf plot by placing the tens digit as the stem and the ones digit as the leaf.
Target Users:
This worksheet is ideal for students learning about data representation and stem and leaf plots in their math curriculum. It can also be used for review or as a supplemental activity for students who need extra practice with data organization.