


1 / 2
0
Views
0
Downloads

0.0
0
0 Likes
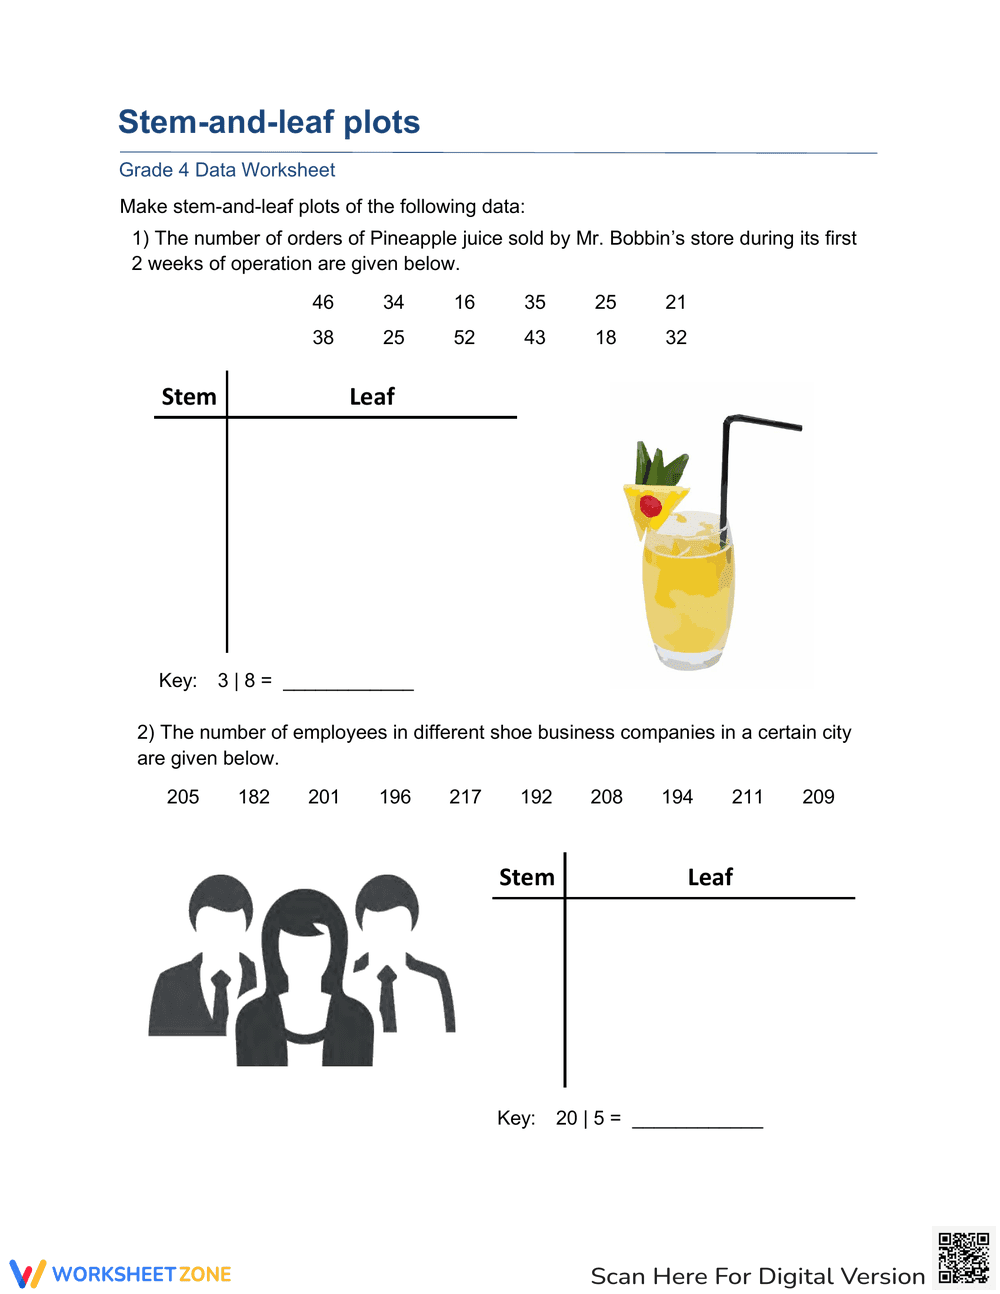
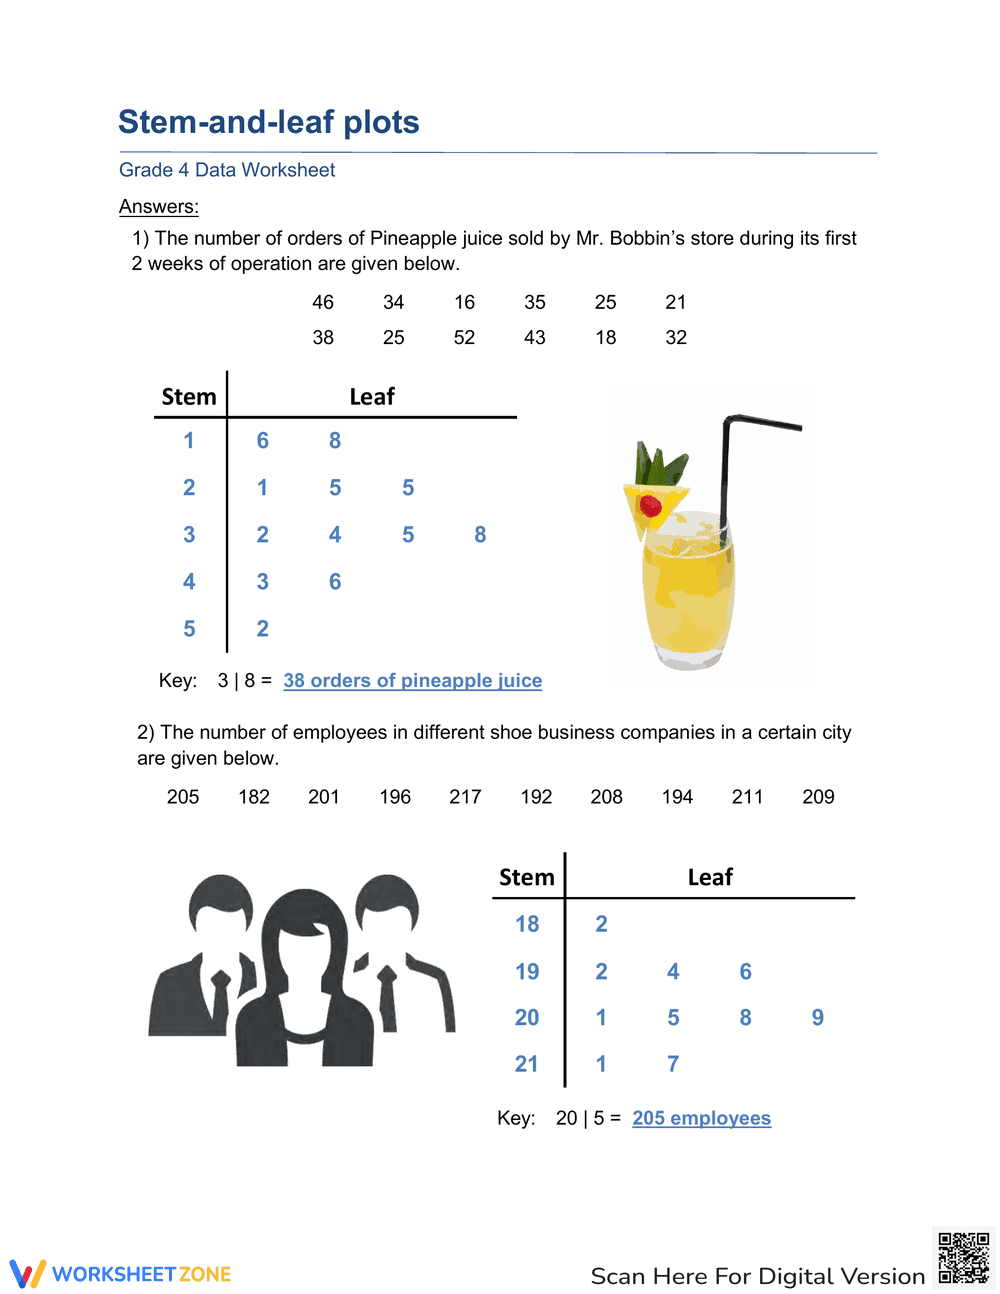
Create Stem and Leaf Plots with this Worksheet
0 Views
0 Downloads
Paste this activity's link or code into your existing LMS (Google Classroom, Canvas, Teams, Schoology, Moodle, etc.).
Students can open and work on the activity right away, with no student login required.
You'll still be able to track student progress and results from your teacher account.
Information
Description
What It Is:
This is a Grade 4 data worksheet focused on stem-and-leaf plots. It presents two data sets: the number of pineapple juice orders and the number of employees in shoe business companies. Students are required to create stem-and-leaf plots to organize and represent the data, using provided templates. A key is provided for each plot to guide students on how to interpret the stem and leaf values.
Grade Level Suitability:
This worksheet is suitable for Grade 4 students. The data sets involve two and three-digit numbers, and the activity focuses on organizing data in a stem-and-leaf plot, which aligns with typical Grade 4 data analysis skills.
Why Use It:
This worksheet helps students develop data organization and representation skills using stem-and-leaf plots. It reinforces understanding of place value and provides a visual method for analyzing data distribution. It also allows students to practice interpreting data presented in this format.
How to Use It:
Students should first read the provided data set. Then, they should identify the stems (tens or hundreds place) and leaves (ones place) for each data point. Next, they should create the stem-and-leaf plot by writing the stems in the left column and the corresponding leaves in the right column. Finally, they should use the provided key to understand the meaning of the stems and leaves in context.
Target Users:
The target users are Grade 4 students learning about data representation and stem-and-leaf plots. It is also suitable for teachers looking for engaging data analysis activities or for parents who want to reinforce their child's understanding of data organization.