


0
Views
0
Downloads

0.0
0
0 Likes
Stem and Leaf Plots: Practice the Skill
0 Views
0 Downloads
Paste this activity's link or code into your existing LMS (Google Classroom, Canvas, Teams, Schoology, Moodle, etc.).
Students can open and work on the activity right away, with no student login required.
You'll still be able to track student progress and results from your teacher account.
Information
Description
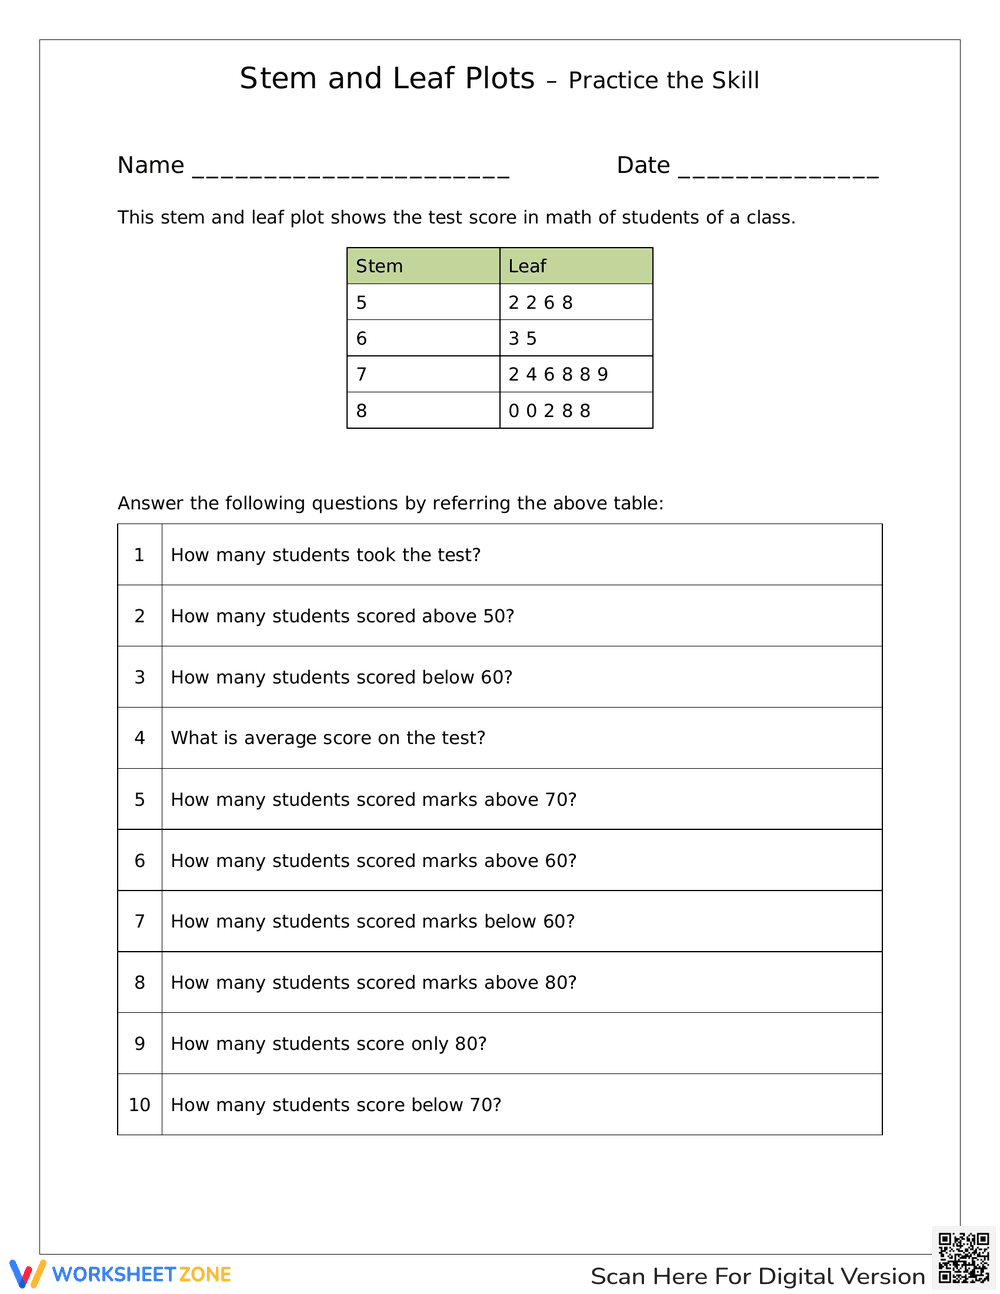
What It Is:
This is a math worksheet focused on stem and leaf plots. It presents a completed stem and leaf plot showing test scores of students in a class. The worksheet then provides ten questions that require students to analyze and interpret the data presented in the plot, such as finding the number of students who took the test, how many scored above or below certain scores, and what the average score is.
Grade Level Suitability:
This worksheet is suitable for grades 5-7. It requires understanding of data representation, specifically stem and leaf plots, and basic statistical concepts like average. The questions are designed to test comprehension and analytical skills at a middle school level.
Why Use It:
This worksheet helps students practice interpreting stem and leaf plots, which is a key skill in data analysis and statistics. It reinforces understanding of how data is organized and presented, and how to extract meaningful information from it. It also promotes critical thinking and problem-solving skills.
How to Use It:
Students should first read the stem and leaf plot carefully, understanding what the stems and leaves represent in the context of test scores. Then, they should answer each of the ten questions by referring back to the data in the plot. They may need to perform simple calculations to determine averages or counts.
Target Users:
This worksheet is designed for students learning about data representation and stem and leaf plots. It's suitable for classroom practice, homework assignments, or as a review tool for students who need extra help with data analysis. It can also be used by teachers as an assessment tool to gauge student understanding.