


0
Views
0
Downloads

0.0
0
0 Likes
Practice Stem and Leaf Plots
0 Views
0 Downloads
Paste this activity's link or code into your existing LMS (Google Classroom, Canvas, Teams, Schoology, Moodle, etc.).
Students can open and work on the activity right away, with no student login required.
You'll still be able to track student progress and results from your teacher account.
Information
Description
What It Is:
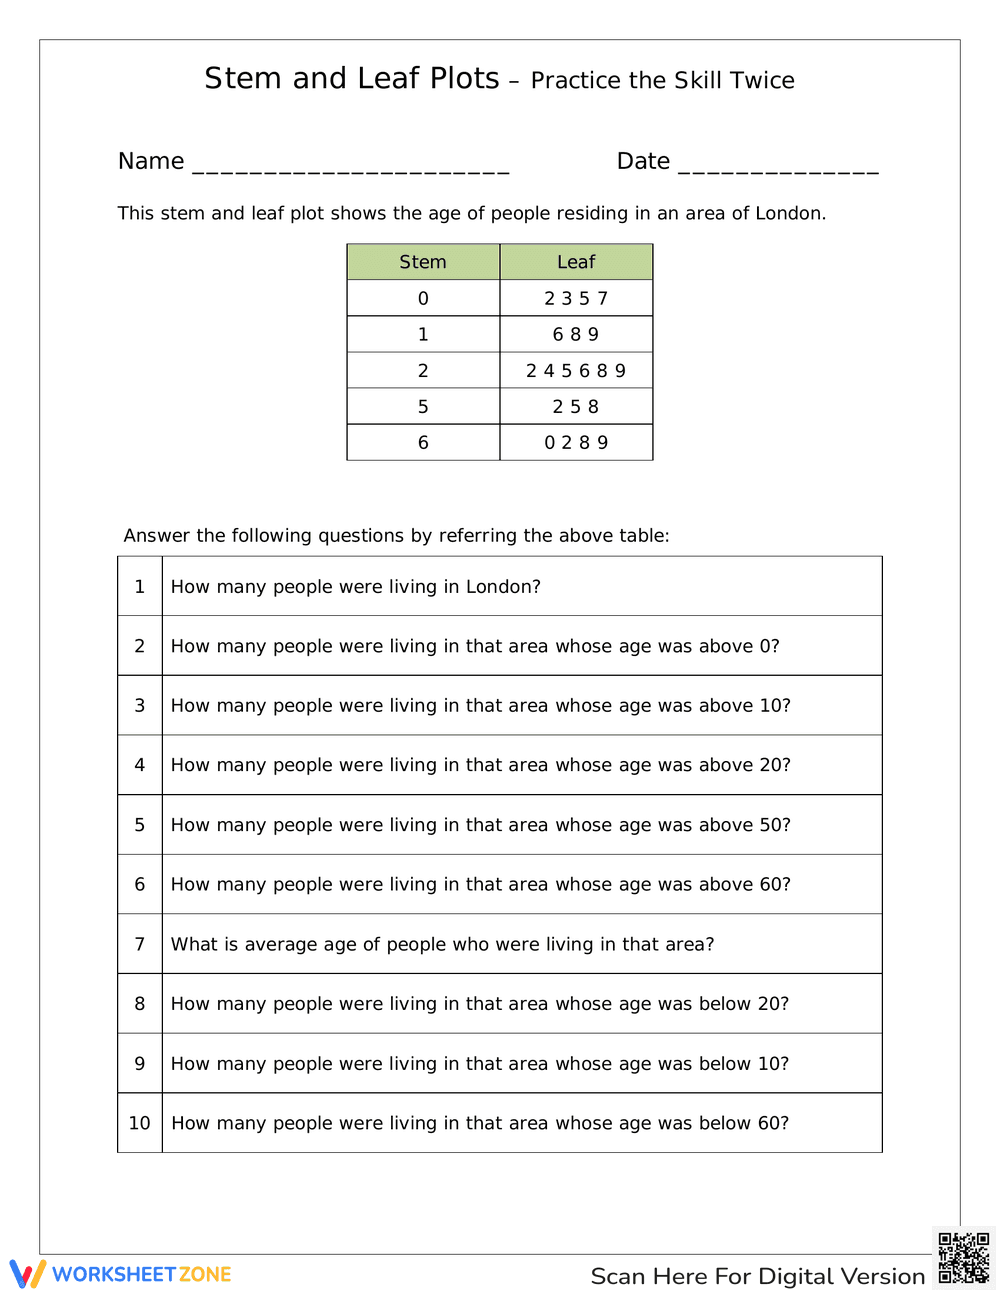
This is a math worksheet focused on stem and leaf plots. It presents a stem and leaf plot showing the ages of people residing in an area of London. Students are asked to answer ten questions based on the information presented in the plot, including questions about the number of people above or below certain ages, and the average age.
Grade Level Suitability:
This worksheet is suitable for grades 6-8. It requires students to interpret data from a stem and leaf plot and perform basic calculations, which are skills typically taught in these grade levels.
Why Use It:
This worksheet helps students practice and reinforce their understanding of stem and leaf plots. It improves data interpretation skills, critical thinking, and the ability to draw conclusions from statistical data. It also provides practice with calculating averages.
How to Use It:
Students should first read the stem and leaf plot carefully, understanding how to interpret the data. Then, they should answer the questions provided, using the information from the plot to determine the number of people in different age ranges and calculate the average age.
Target Users:
This worksheet is designed for middle school students learning about data analysis and stem and leaf plots. It can be used by teachers in the classroom or by parents for supplemental practice at home.