


0
Views
0
Downloads

0.0
0
0 Likes
Stem and Leaf Plots: Skill Practice Worksheet
0 Views
0 Downloads
Paste this activity's link or code into your existing LMS (Google Classroom, Canvas, Teams, Schoology, Moodle, etc.).
Students can open and work on the activity right away, with no student login required.
You'll still be able to track student progress and results from your teacher account.
Information
Description
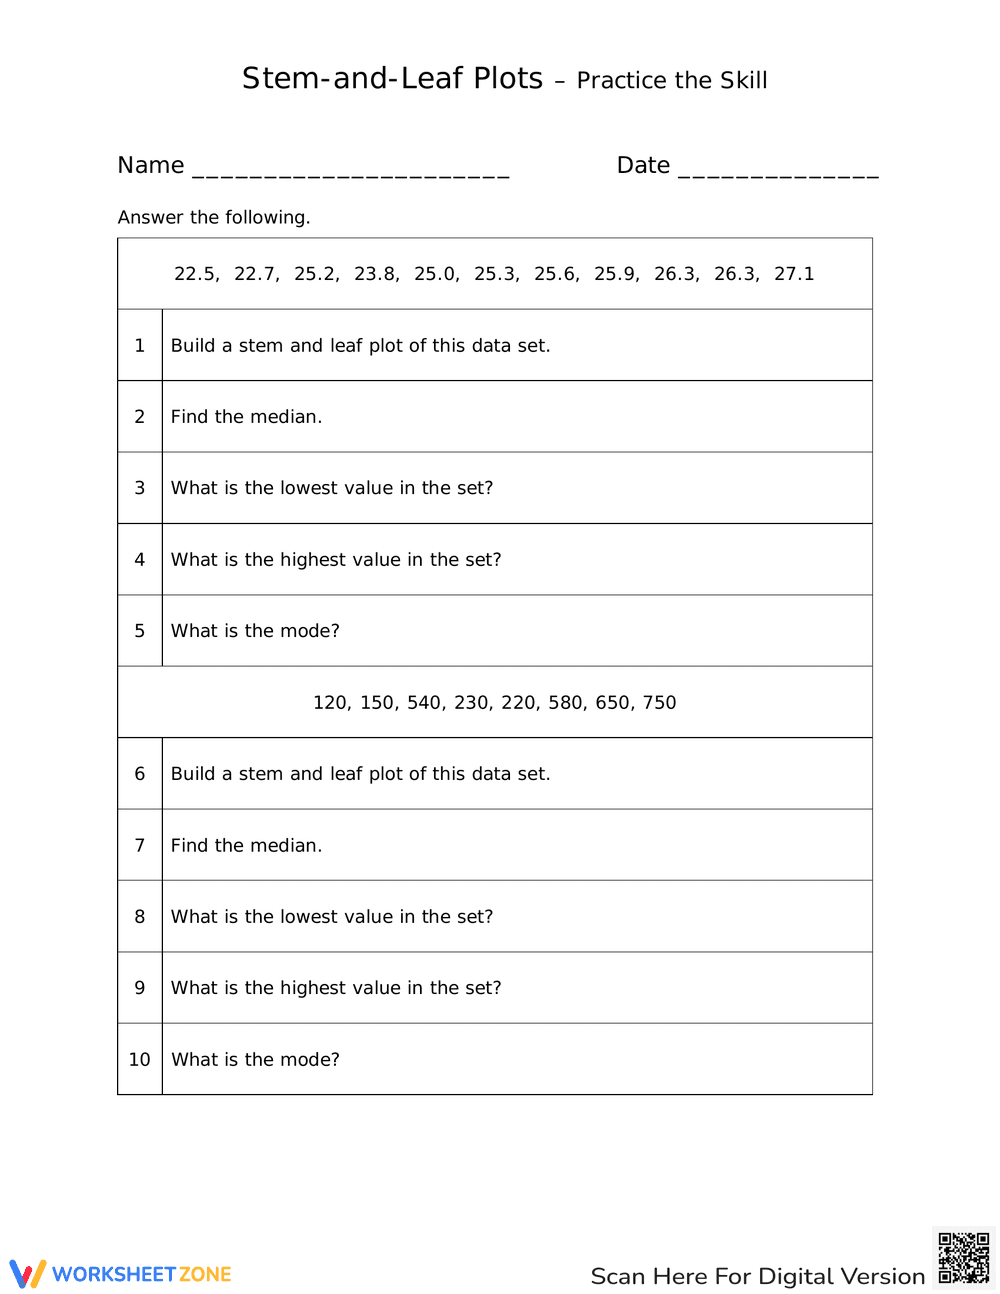
What It Is:
This is an educational worksheet focused on stem-and-leaf plots. It presents two sets of numerical data and asks the student to build a stem-and-leaf plot for each set. In addition, students must find the median, identify the lowest and highest values, and determine the mode for each data set.
Grade Level Suitability:
This worksheet is suitable for grades 6-8. It requires an understanding of decimal numbers and larger numbers, as well as the ability to organize data and calculate statistical measures like median and mode.
Why Use It:
This worksheet provides practice in creating and interpreting stem-and-leaf plots. It reinforces understanding of statistical concepts like median, mode, minimum, and maximum values within a dataset. It helps students develop data organization and analytical skills.
How to Use It:
First, read the instructions and the provided data set. Then, construct a stem-and-leaf plot for each data set. After creating the plot, answer the questions about the median, lowest value, highest value, and mode for each set. Show your work.
Target Users:
This worksheet is designed for students learning about stem-and-leaf plots and basic statistics. It's also helpful for students needing additional practice in data organization and interpretation. It is suitable for classroom use or for independent study.