


1 / 2
0
Views
0
Downloads

0.0
0
0 Likes
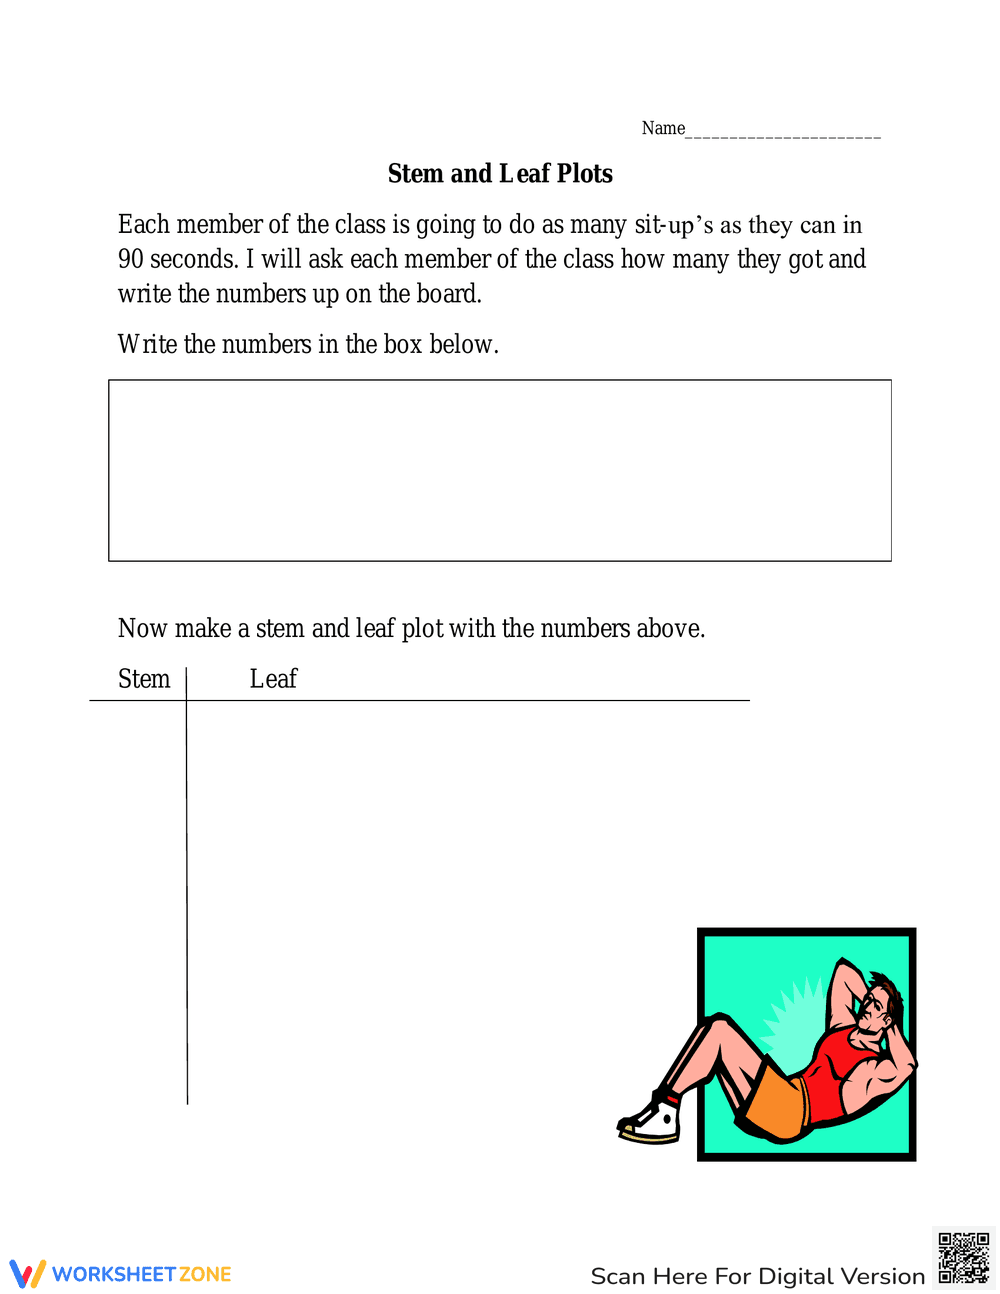
Stem and Leaf Plots: Data Analysis Worksheet
0 Views
0 Downloads
Paste this activity's link or code into your existing LMS (Google Classroom, Canvas, Teams, Schoology, Moodle, etc.).
Students can open and work on the activity right away, with no student login required.
You'll still be able to track student progress and results from your teacher account.
Information
Description
What It Is:
This is a math worksheet focused on creating stem and leaf plots. It instructs students to record the number of sit-ups each classmate can do in 90 seconds. Students will then write the numbers in the provided box and use this data to create a stem and leaf plot in the provided table with 'Stem' and 'Leaf' columns.
Grade Level Suitability:
This worksheet is suitable for grades 4-6. It involves data collection and organization using stem and leaf plots, which are typically introduced in these grade levels. The physical activity component makes it engaging for this age group.
Why Use It:
This worksheet provides a hands-on way to learn about stem and leaf plots. It combines physical activity with data collection, making the learning experience more engaging and memorable. It helps students practice data organization and interpretation skills.
How to Use It:
First, have each student perform sit-ups for 90 seconds. Record each student's number of sit-ups in the box. Then, use the numbers in the box to create a stem and leaf plot. The stem represents the tens digit, and the leaf represents the ones digit.
Target Users:
This worksheet is designed for elementary and middle school students learning about data analysis and stem and leaf plots. It is also suitable for teachers looking for an engaging activity to teach data organization and representation.