


1 / 2
0
Views
0
Downloads

0.0
0
0 Likes
Thanksgiving Graphing Worksheet for Data Analysis
0 Views
0 Downloads
Paste this activity's link or code into your existing LMS (Google Classroom, Canvas, Teams, Schoology, Moodle, etc.).
Students can open and work on the activity right away, with no student login required.
You'll still be able to track student progress and results from your teacher account.
Information
Description
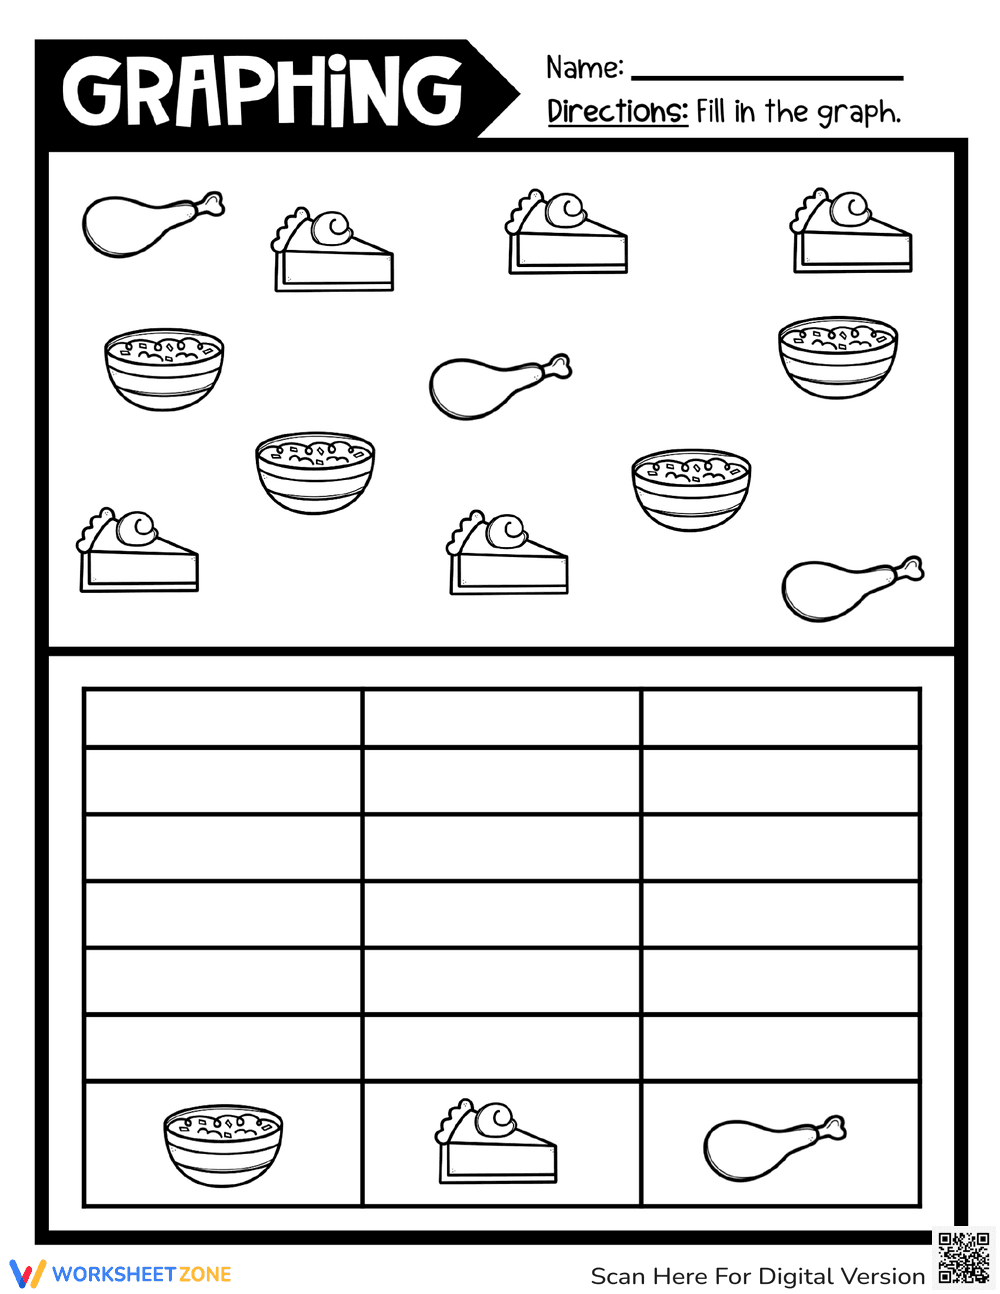
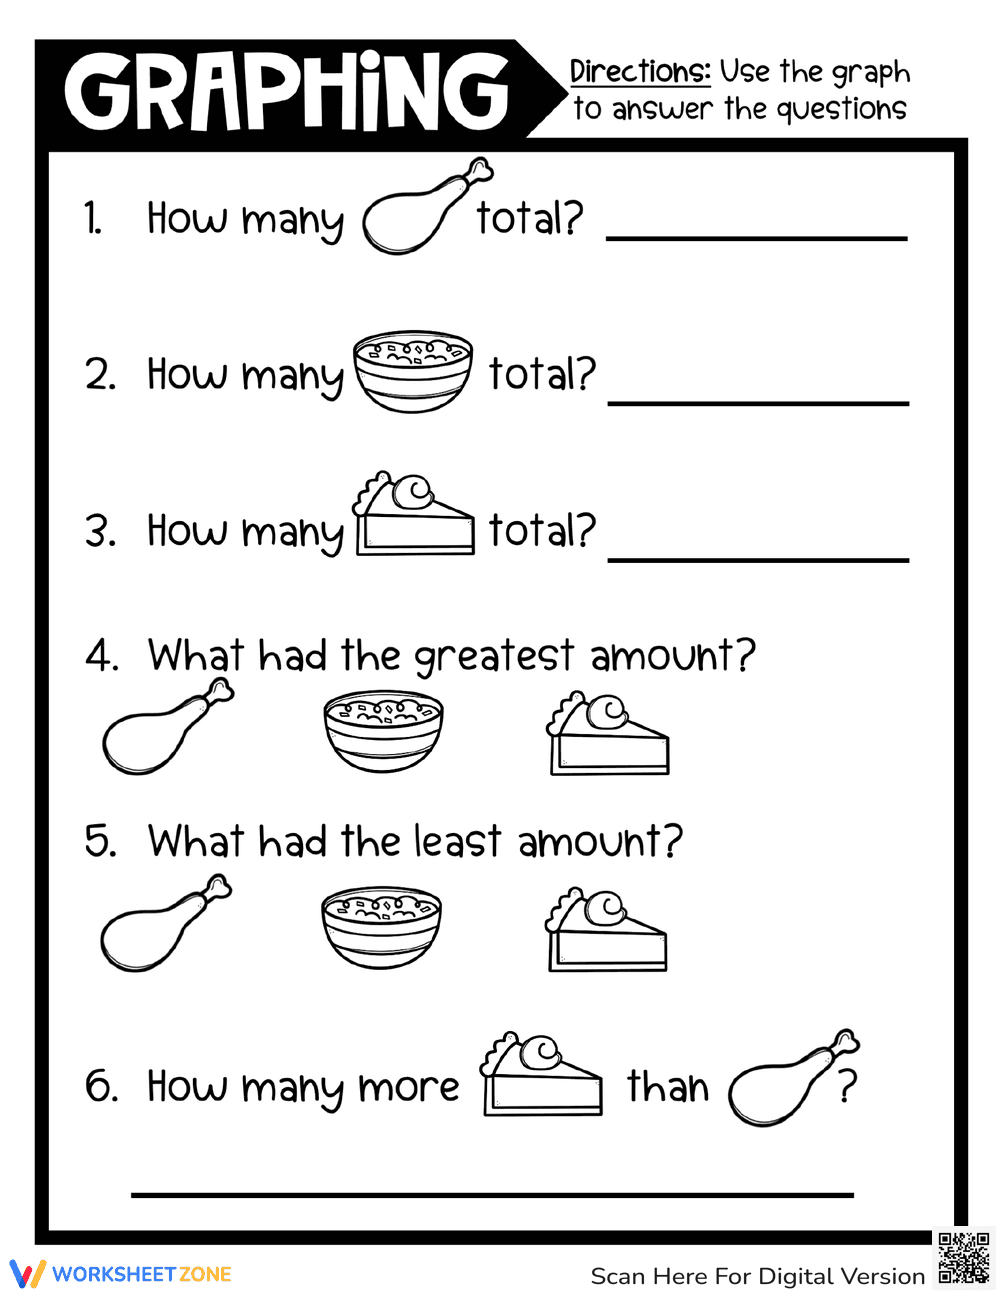
What It Is:
This is a graphing worksheet featuring pictures of food items: turkey legs, bowls of food, and slices of pie. Students are instructed to fill in the graph based on the number of each item present in the picture above. The graph has three columns, one for each food item.
Grade Level Suitability:
This worksheet is suitable for Kindergarten and 1st grade. The activity requires simple counting and graphing skills, which are typically introduced at these grade levels. The use of pictures makes it visually engaging for young learners.
Why Use It:
This worksheet helps develop counting skills, data representation, and graphing abilities. It reinforces one-to-one correspondence and teaches children how to organize data in a simple graph. It also improves visual discrimination skills.
How to Use It:
First, have the student count the number of each food item (turkey legs, bowls of food, and pie slices) in the picture. Then, instruct them to fill in the corresponding column in the graph, perhaps by coloring in the squares or drawing a symbol for each item counted. Ensure the student understands to stop filling the column when they reach the correct number for each item.
Target Users:
This worksheet is designed for preschool, kindergarten, and first-grade students who are learning basic counting and graphing skills. It is also suitable for students who need extra practice with visual discrimination and data representation.