


1 / 4
0
Views
0
Downloads


0.0
0
0 Likes
Write Linear Equations from Graphs Worksheet
0 Views
0 Downloads
Paste this activity's link or code into your existing LMS (Google Classroom, Canvas, Teams, Schoology, Moodle, etc.).
Students can open and work on the activity right away, with no student login required.
You'll still be able to track student progress and results from your teacher account.
Information
Description
What It Is:
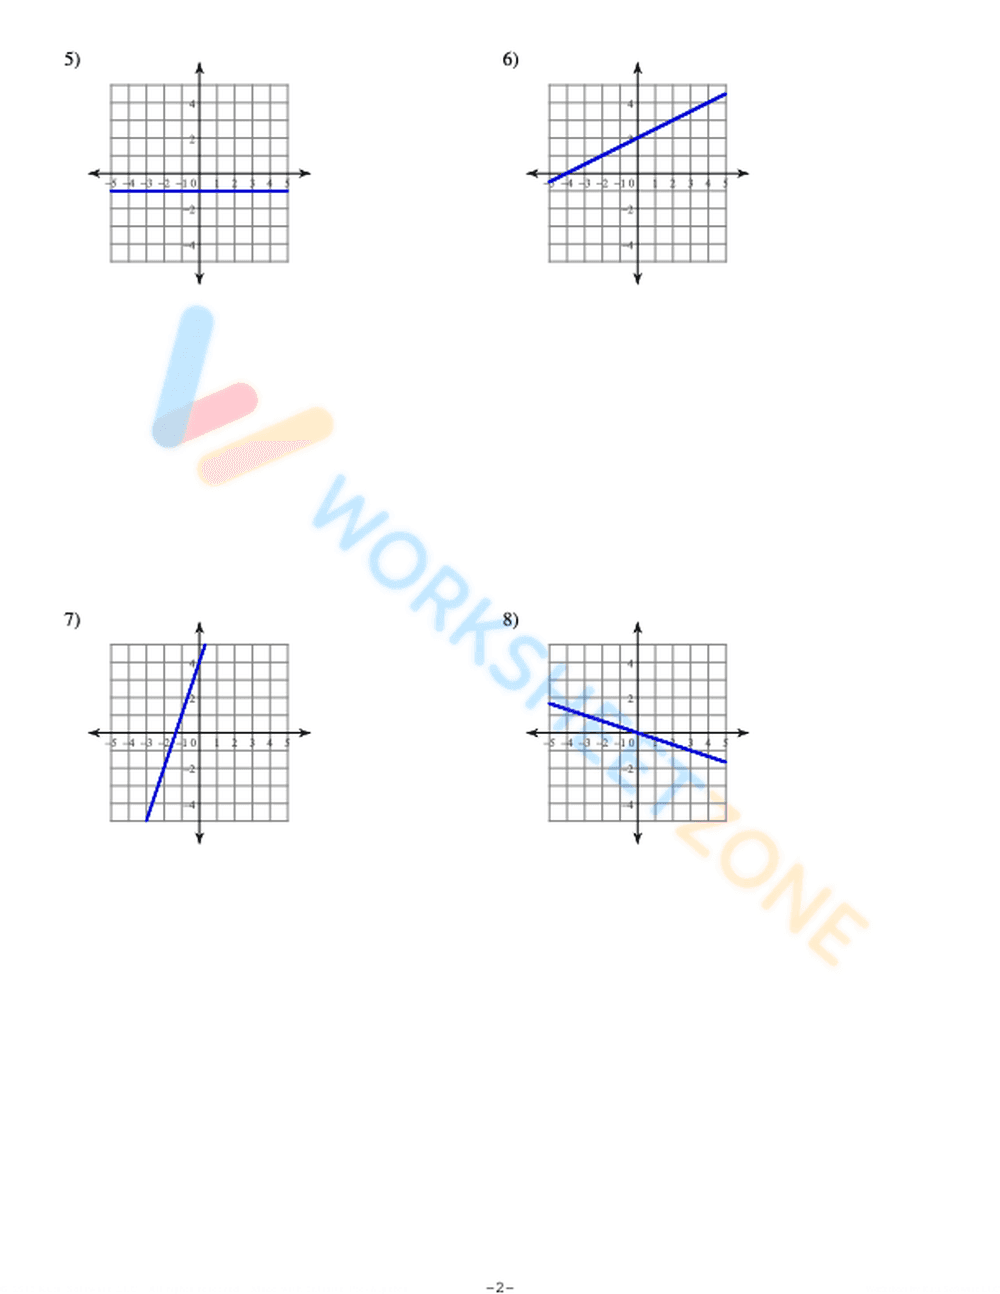
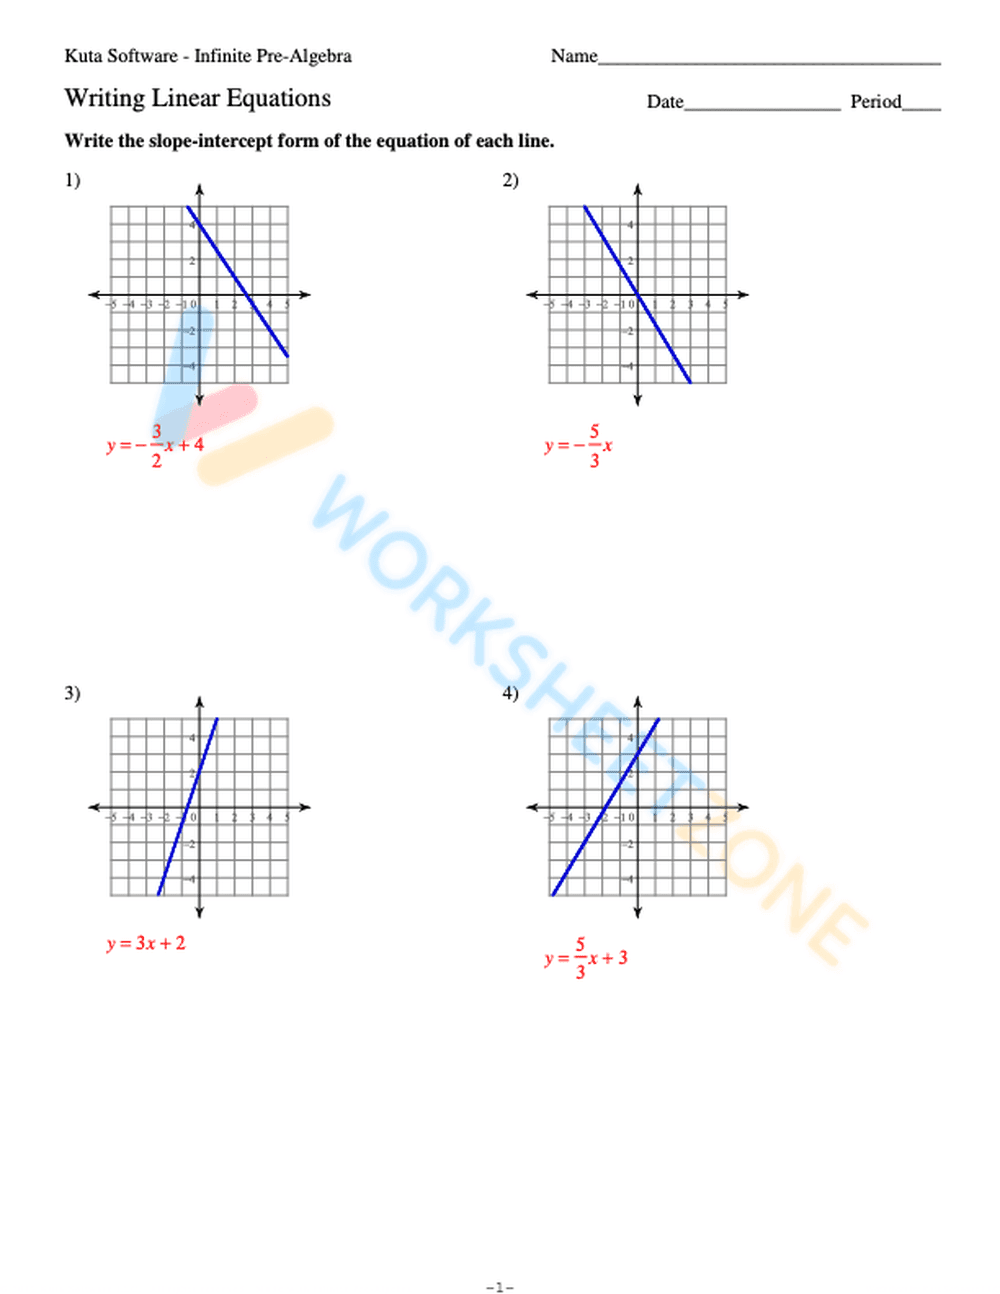
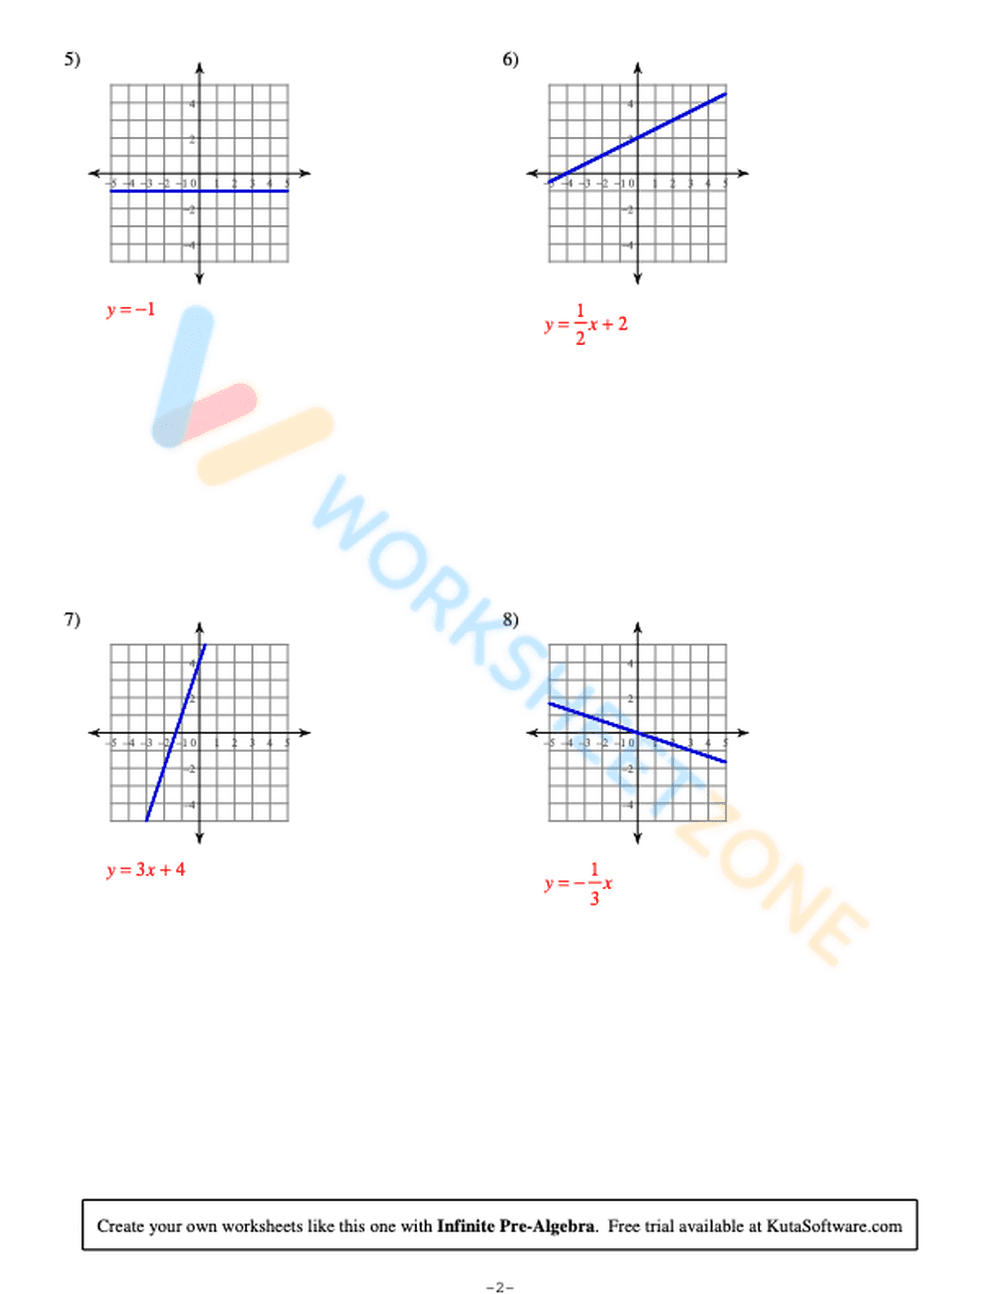
This is a math worksheet focused on writing linear equations. The worksheet contains four coordinate plane graphs, each displaying a straight line. The task is to write the slope-intercept form of the equation for each line shown in the graphs.
Grade Level Suitability:
This worksheet is suitable for grades 8-10, specifically for pre-algebra or algebra 1 students. It requires understanding of coordinate planes, linear equations, slope, and y-intercept, which are typically taught in these grades.
Why Use It:
This worksheet provides practice in interpreting graphs and translating visual information into algebraic equations. It reinforces the concept of slope-intercept form (y = mx + b) and helps students connect the visual representation of a line with its corresponding equation. It strengthens skills in identifying slope and y-intercept from a graph.
How to Use It:
Students should examine each graph, determine the slope (rise over run) and y-intercept (where the line crosses the y-axis). Then, they should substitute these values into the slope-intercept form equation (y = mx + b) to write the equation for each line.
Target Users:
The target users are students in pre-algebra or algebra 1 who are learning or reviewing linear equations and slope-intercept form. It is also suitable for students who need extra practice in interpreting graphs and writing equations.