


0
Views
0
Downloads

0.0
0
0 Likes
Linear vs. Nonlinear Functions: Graphs, Equations & Tables!
0 Views
0 Downloads
Paste this activity's link or code into your existing LMS (Google Classroom, Canvas, Teams, Schoology, Moodle, etc.).
Students can open and work on the activity right away, with no student login required.
You'll still be able to track student progress and results from your teacher account.
Information
Description
What It Is:
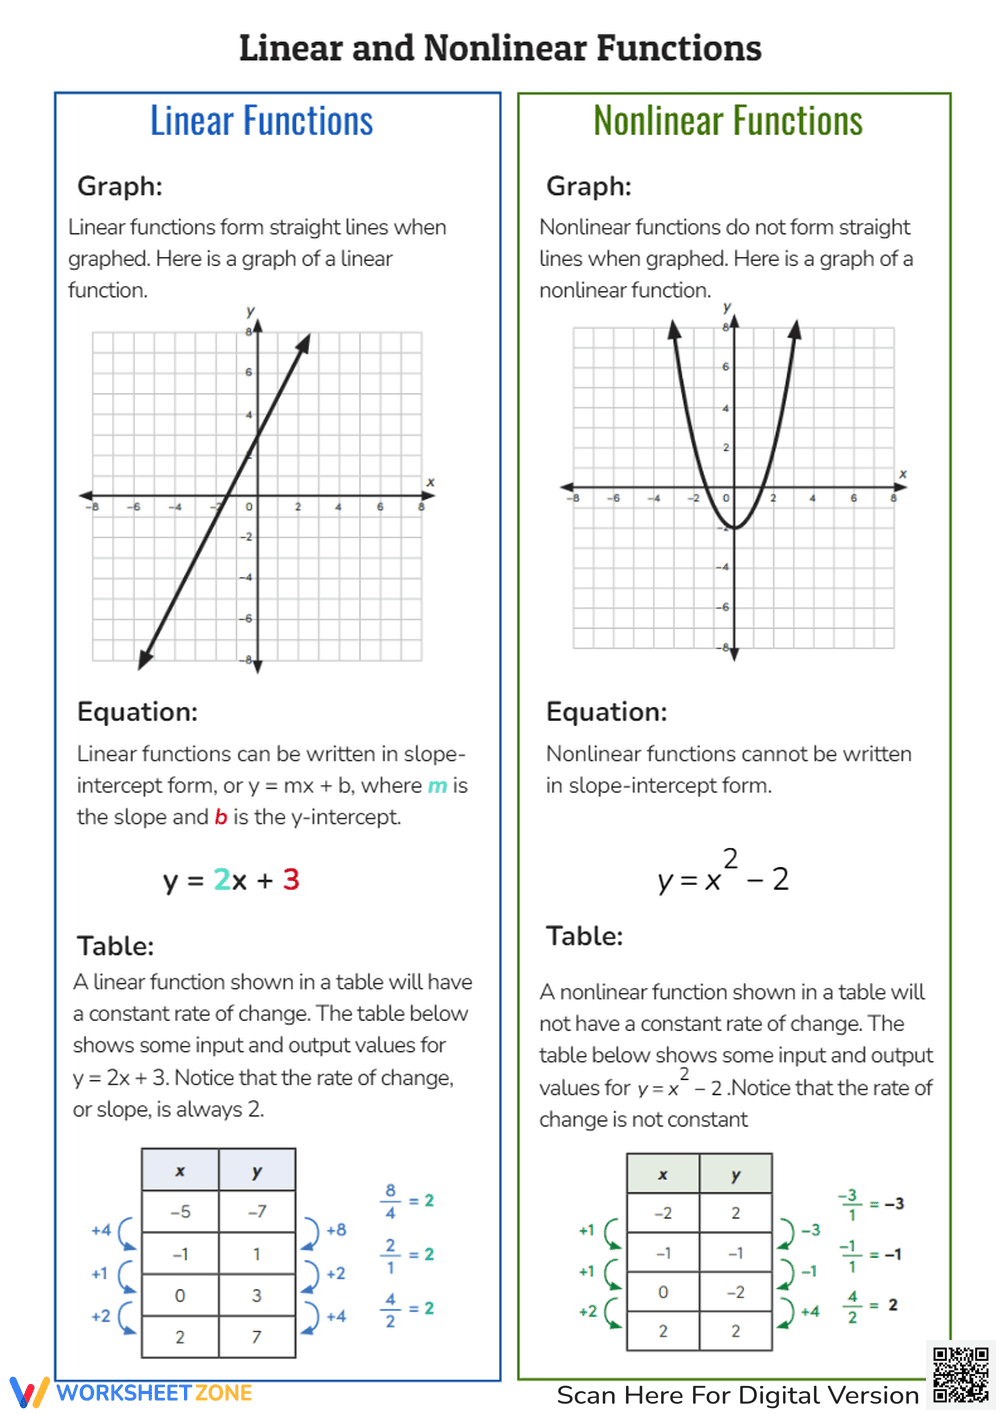
This worksheet provides an introduction to linear and nonlinear functions. It shows examples of each type of function represented as a graph, an equation, and a table of values. For linear functions, it shows a straight line graph, the equation y=2x+3, and a table demonstrating a constant rate of change. For nonlinear functions, it shows a parabola graph, the equation y=x²-2, and a table showing a non-constant rate of change.
Grade Level Suitability:
This worksheet is suitable for grades 8-10. It introduces concepts of linear and nonlinear functions, which are typically taught in pre-algebra and algebra courses. The worksheet includes graphing, equation analysis, and data interpretation.
Why Use It:
This worksheet helps students understand the difference between linear and nonlinear functions by visually representing them in multiple formats: graphs, equations, and tables. It reinforces the concept of a constant rate of change for linear functions and the absence of a constant rate of change for nonlinear functions.
How to Use It:
Use this worksheet as an introductory lesson or review activity. Students can analyze the graphs, equations, and tables to identify the characteristics of linear and nonlinear functions. They can also use the examples as a reference for solving related problems.
Target Users:
This worksheet is ideal for students learning about linear and nonlinear functions in pre-algebra, algebra 1, or introductory math courses. It can also be used by teachers as a visual aid and practice resource.